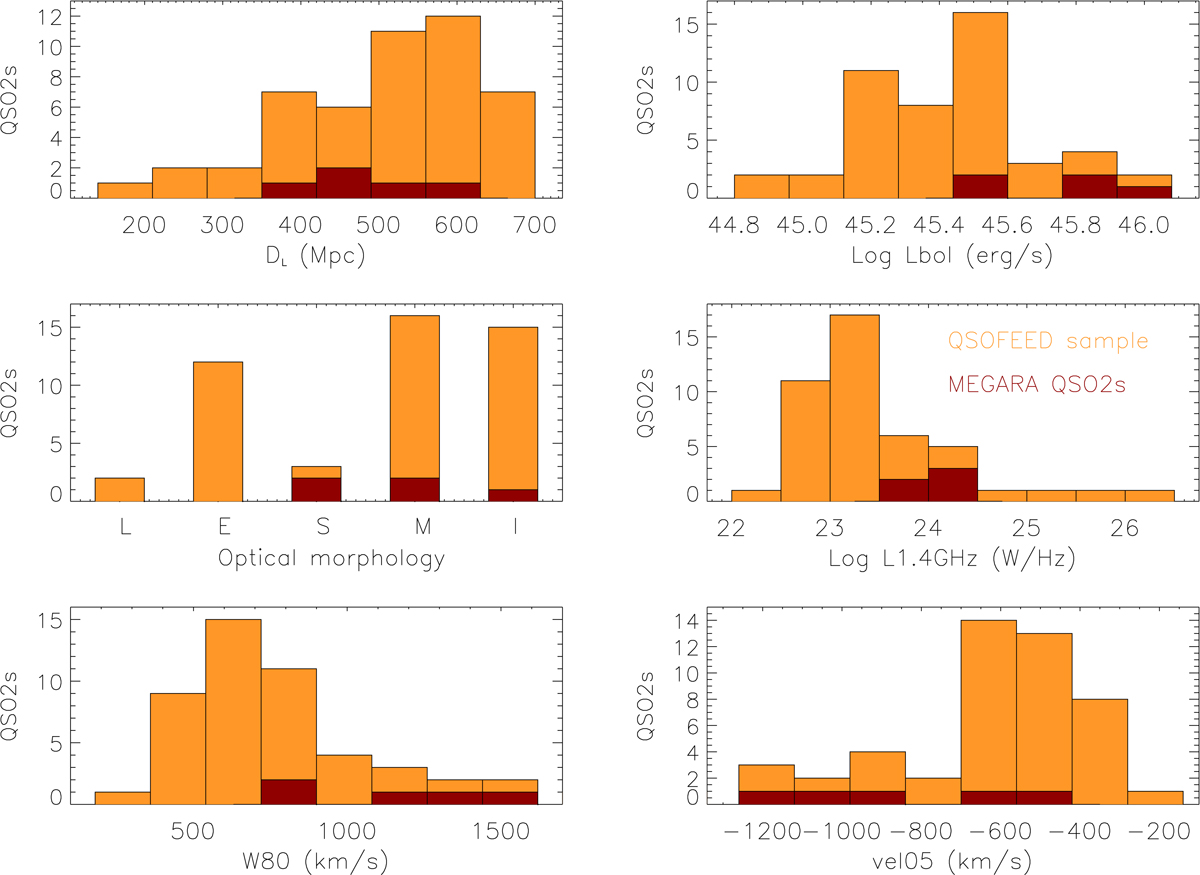
Fig. 1.
Download original image
Orange and red histograms correspond to all QSO2s in the QSOFEED sample and to the five QSO2s studied here. From left to right and from top to bottom: luminosity distance, AGN luminosity, optical morphology (L=lenticular, E=elliptical, S=spiral, M=merger, I=interacting), integrated radio luminosity from FIRST 1.4 GHz data, W80, and vel05 of the [O III] line profile measured from SDSS optical spectra of the targets (Bessiere et al., in prep.). SDSS J134733.36+121724.3 was excluded from the W80 and vel05 histograms because of its extreme kinematics (W80 = 2500 km s−1 and vel05 = −2500 km s−1).
Current usage metrics show cumulative count of Article Views (full-text article views including HTML views, PDF and ePub downloads, according to the available data) and Abstracts Views on Vision4Press platform.
Data correspond to usage on the plateform after 2015. The current usage metrics is available 48-96 hours after online publication and is updated daily on week days.
Initial download of the metrics may take a while.