Fig. 3
Download original image
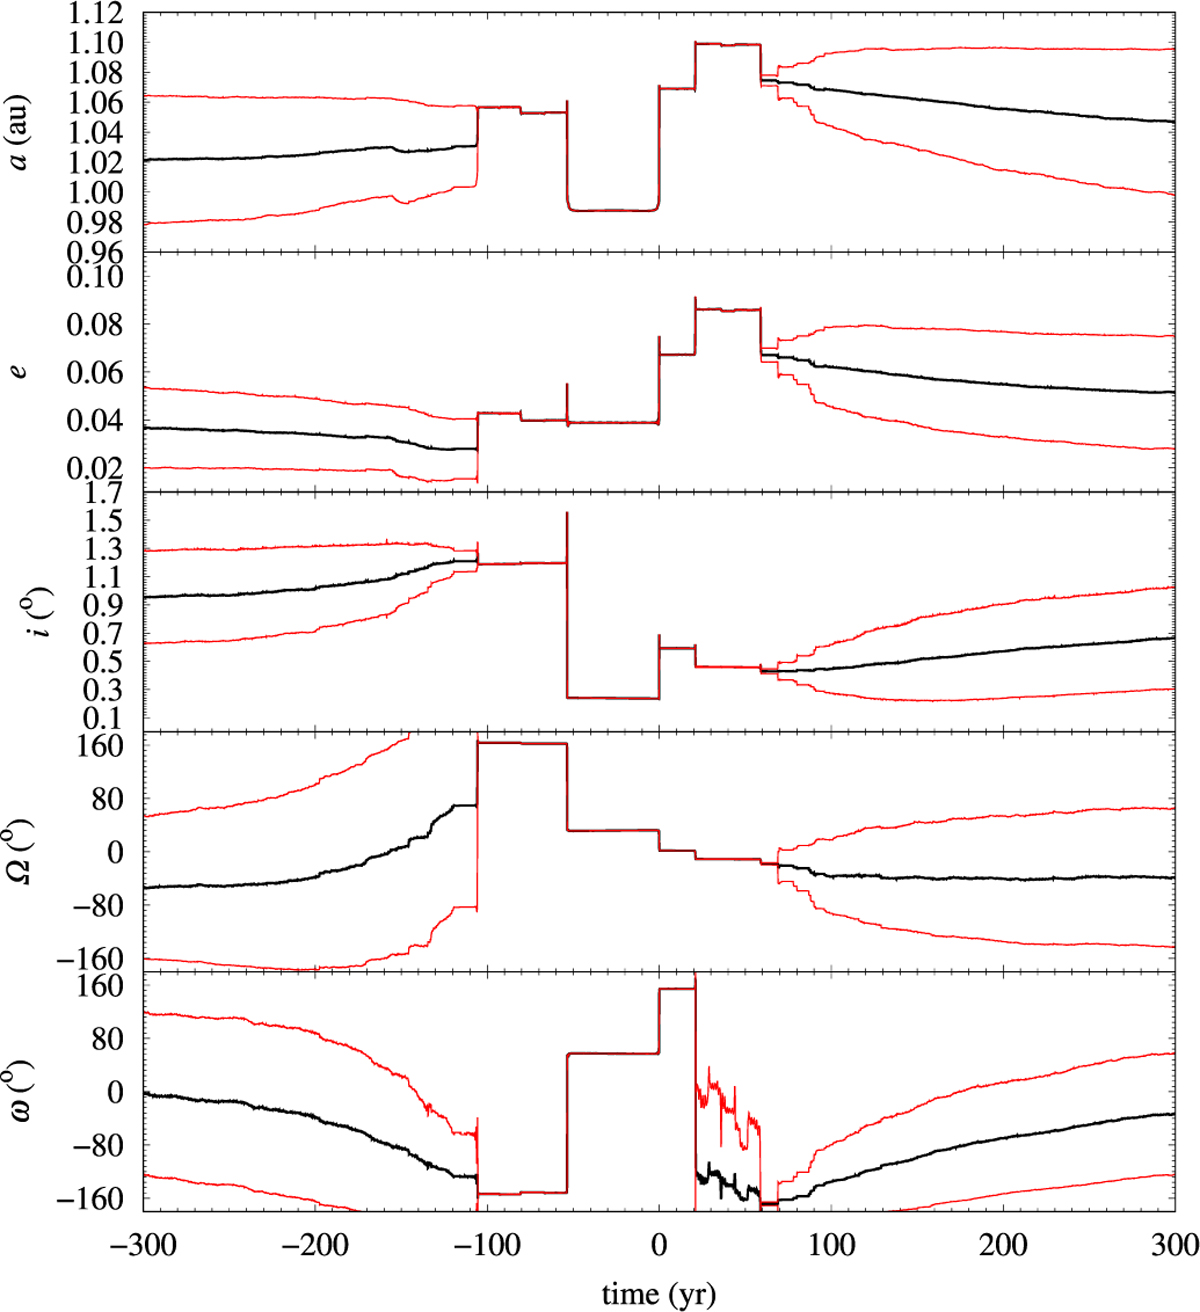
Time evolution of the values of the semimajor axis (a, top panel), eccentricity (e, second-from-the-top panel), inclination (i, third-from-the-bottom panel), ascending node (Ω, second-from-the-bottom panel), and argument of perihelion (ω, bottom panel) of 2023 FY3 according to the Monte Carlo covariance matrix (MCCM) approach discussed by de la Fuente Marcos & de la Fuente Marcos (2015b). The panels display the results of the integrations of 103 control orbits with initial positions and velocities generated using the MCCM method. In black, we display the average evolution of the value of the orbital element and in red we show their respective ranges, described by the 1σ uncertainty or the 16th and 84th percentiles. The output cadence is 0.1 yr. The source of the input data is JPL’s SBDB and Horizons system, and they are referred to epoch 2460038.5 (April 4, 2023) TDB, which is the origin of time in this figure.
Current usage metrics show cumulative count of Article Views (full-text article views including HTML views, PDF and ePub downloads, according to the available data) and Abstracts Views on Vision4Press platform.
Data correspond to usage on the plateform after 2015. The current usage metrics is available 48-96 hours after online publication and is updated daily on week days.
Initial download of the metrics may take a while.