Fig. 8.
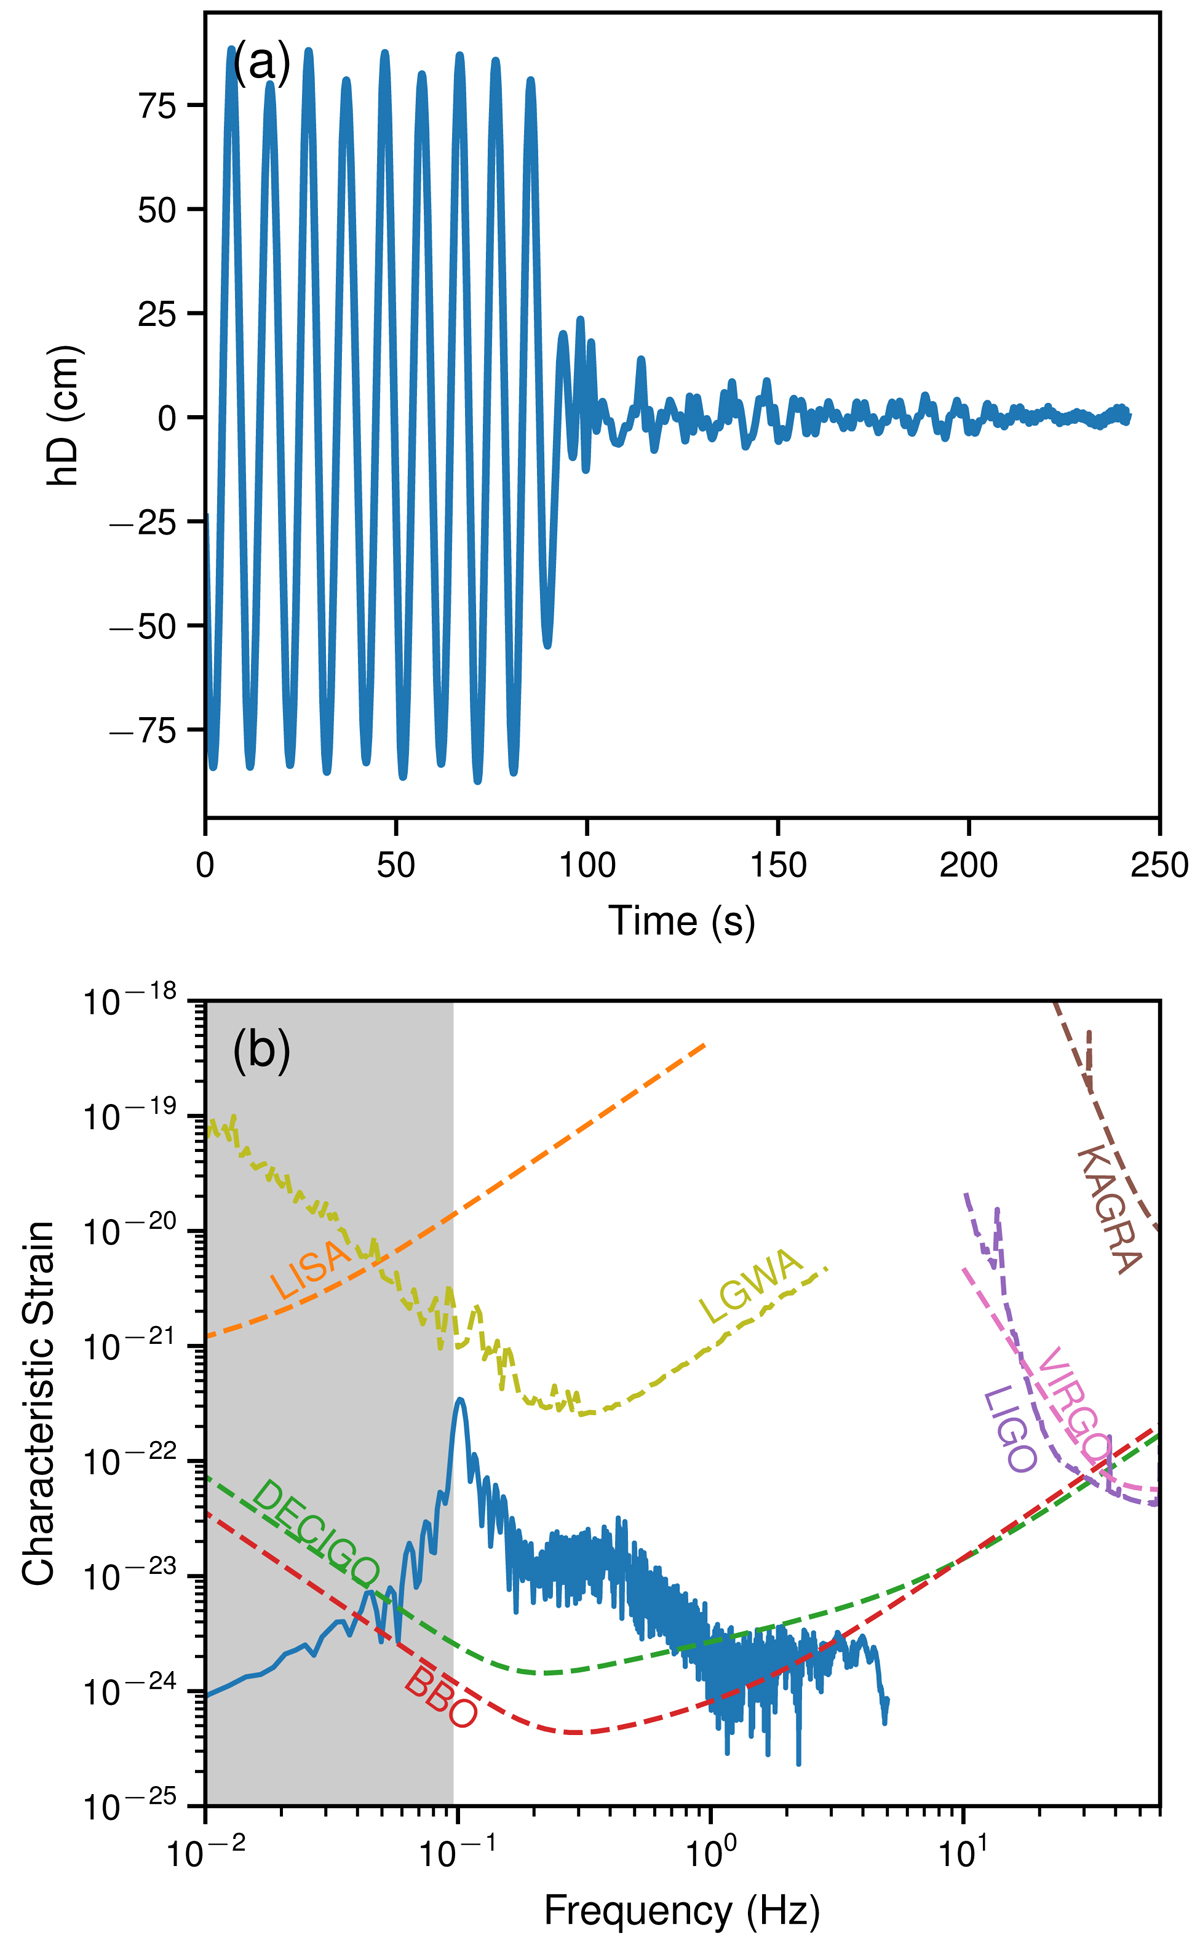
Download original image
Gravitational waves produced in simulation. Top: strain of GW signal h times the distance D to the source, observed from the z-direction (polar axis), over time. Bottom: characteristic strain of GW signal assuming a distance of 1Mpc to the source along the polar axis. The sensitivities of LISA (Robson et al. 2019); DECIGO and BBO (Yagi & Seto 2011); LIGO, VIRGO, and KAGRA (Abbott et al. 2020); and LGWA (Dupletsa et al. 2023) are shown as dashed orange, green, red, purple, brown, and yellow lines, respectively. The gray shaded area denotes the frequencies below two times our initial orbital frequency where signal coming from the inspiral phase of the binary is expected to be present.
Current usage metrics show cumulative count of Article Views (full-text article views including HTML views, PDF and ePub downloads, according to the available data) and Abstracts Views on Vision4Press platform.
Data correspond to usage on the plateform after 2015. The current usage metrics is available 48-96 hours after online publication and is updated daily on week days.
Initial download of the metrics may take a while.