Fig. 4.
Download original image
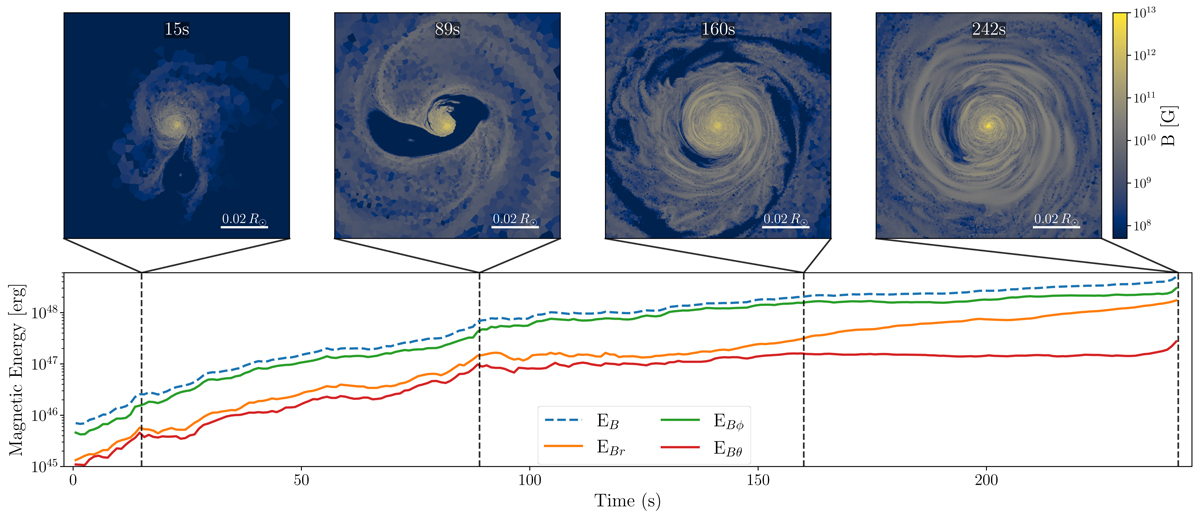
Evolution of magnetic field throughout the simulation. Top: slices through orbital plane, centered on the NS, showing the absolute magnitude of the magnetic field for selected snapshots in color. Bottom: evolution of total magnetic energy over time (blue, dashed line) as well as the energy of the different components of the magnetic field in spherical coordinates (orange, green, and red for the radial, azimuthal, and polar components, respectively).
Current usage metrics show cumulative count of Article Views (full-text article views including HTML views, PDF and ePub downloads, according to the available data) and Abstracts Views on Vision4Press platform.
Data correspond to usage on the plateform after 2015. The current usage metrics is available 48-96 hours after online publication and is updated daily on week days.
Initial download of the metrics may take a while.