Open Access
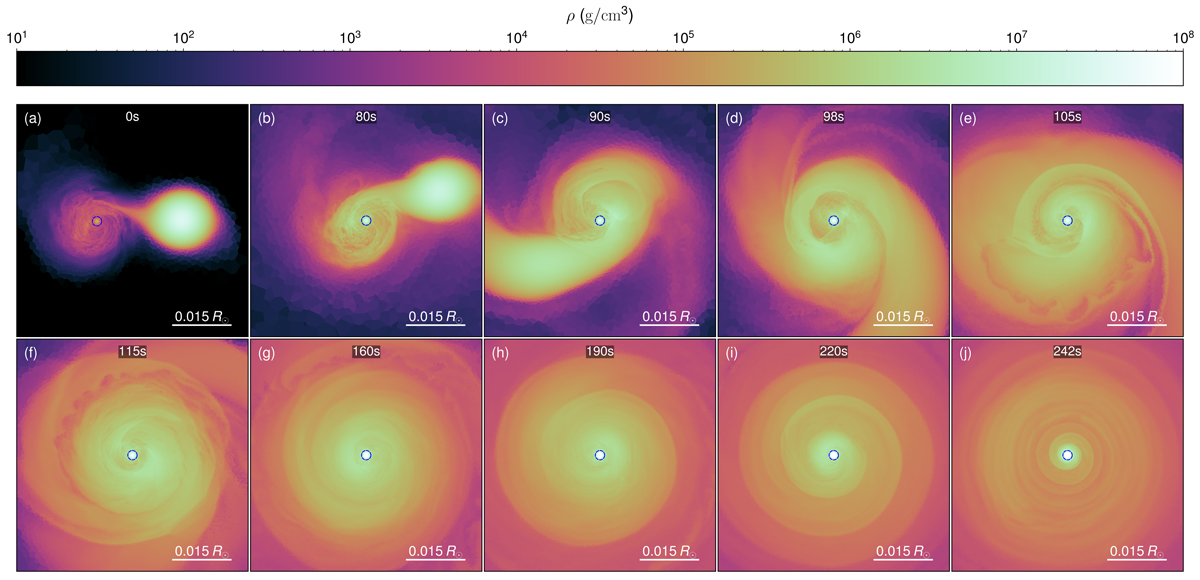
Fig. 1.
Download original image
Hydrodynamical evolution of merger. The panels show density slices in the orbital plane from the beginning of the simulation (panel a) until we stop it at t = 242 s (panel j). The region with a softened gravitational potential is shown in a blue dashed line.
Current usage metrics show cumulative count of Article Views (full-text article views including HTML views, PDF and ePub downloads, according to the available data) and Abstracts Views on Vision4Press platform.
Data correspond to usage on the plateform after 2015. The current usage metrics is available 48-96 hours after online publication and is updated daily on week days.
Initial download of the metrics may take a while.