Fig. 4
Download original image
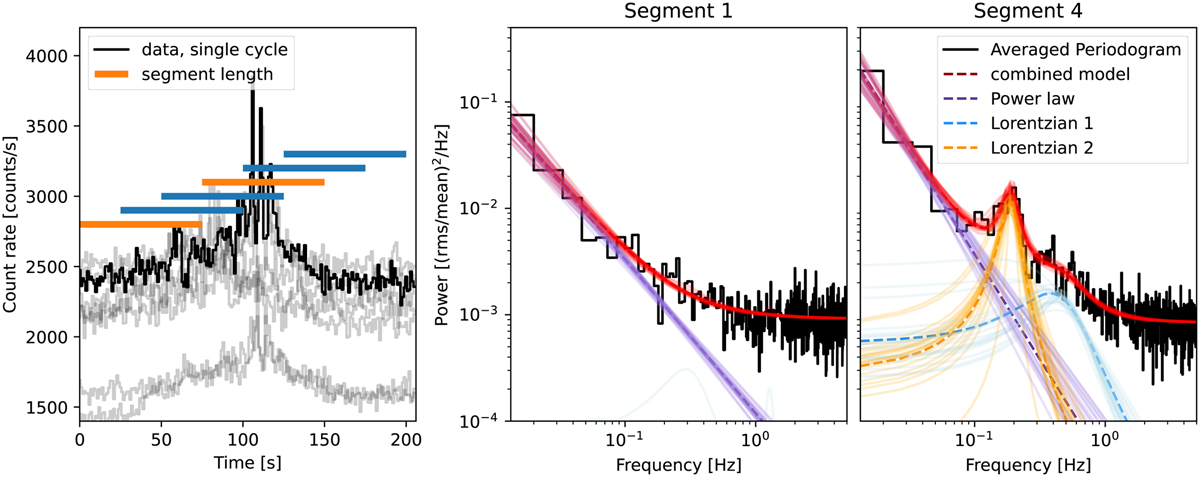
Phase-resolved results for RX J0440. Left: aligned light curves (in gray) of the triggers in Table 1 – one highlighted in black for clarity. Horizontal bars correspond to the segments used for the phase-resolved analysis. Orange bars represent segments in phase used to produce the right panels. Right: periodograms of RX J0440 data at different spin phases, corresponding to segments 1 and 4, as indicated on top. Symbols are as in Fig. 3. The segment 1 panel shows the periodogram resulting from data outside of the pulse profile peak, when the periodogram does not require a second Lorentzian component. The segment 4 panel shows the periodogram obtained from pulse-profile peak-centered data, where a second Lorentzian component is required at ~0.2 Hz.
Current usage metrics show cumulative count of Article Views (full-text article views including HTML views, PDF and ePub downloads, according to the available data) and Abstracts Views on Vision4Press platform.
Data correspond to usage on the plateform after 2015. The current usage metrics is available 48-96 hours after online publication and is updated daily on week days.
Initial download of the metrics may take a while.