Fig. 1
Download original image
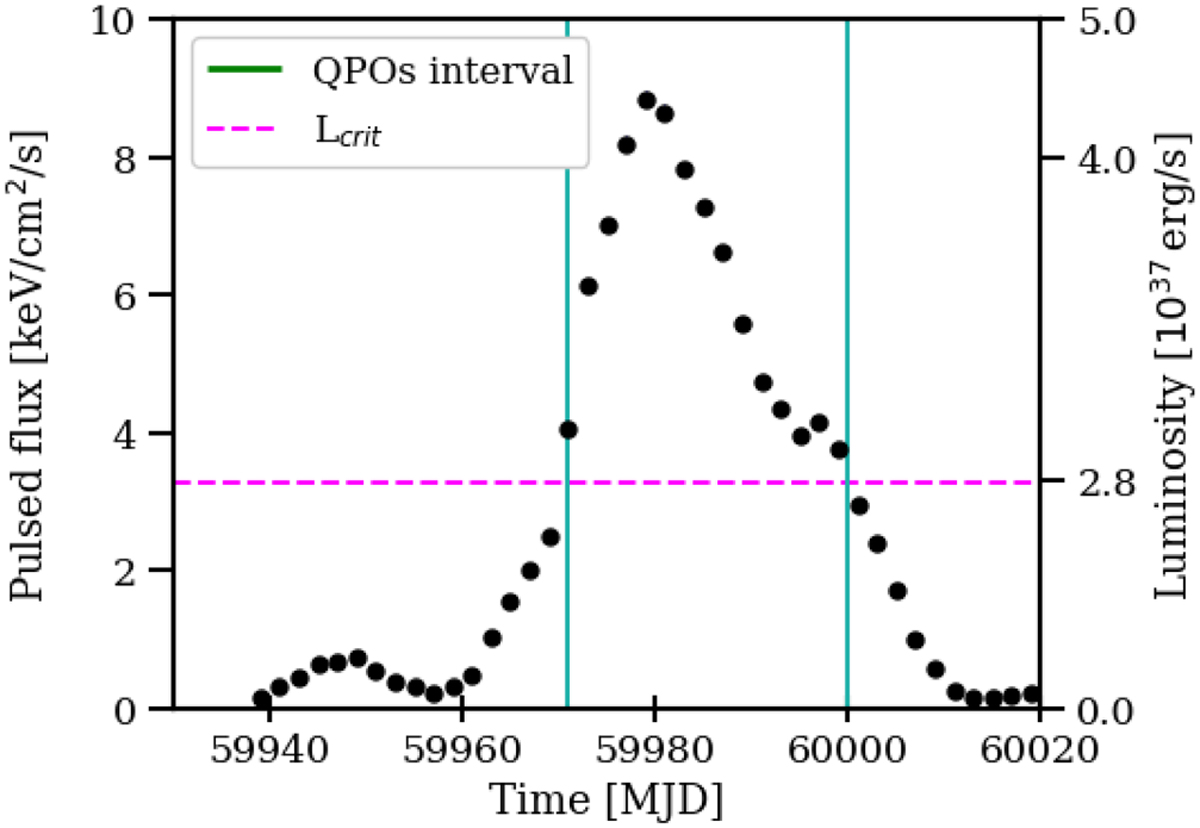
GBM observations of RX J0440 during 2023 outburst. Black dots (with gray error bars) show the GBM (12–50 keV) three-day average pulsed flux. The horizontal magenta dashed line indicates the critical luminosity at 2.8 × 1037 erg s−1 (Salganik et al. 2023) as related to the right y-axis units. The nonlinearity in the right y-axis is due to a variable conversion factor at different outburst stages (see text). The light green vertical continuous lines mark the interval when the source is showing QPO episodes.
Current usage metrics show cumulative count of Article Views (full-text article views including HTML views, PDF and ePub downloads, according to the available data) and Abstracts Views on Vision4Press platform.
Data correspond to usage on the plateform after 2015. The current usage metrics is available 48-96 hours after online publication and is updated daily on week days.
Initial download of the metrics may take a while.