Fig. 9
Download original image
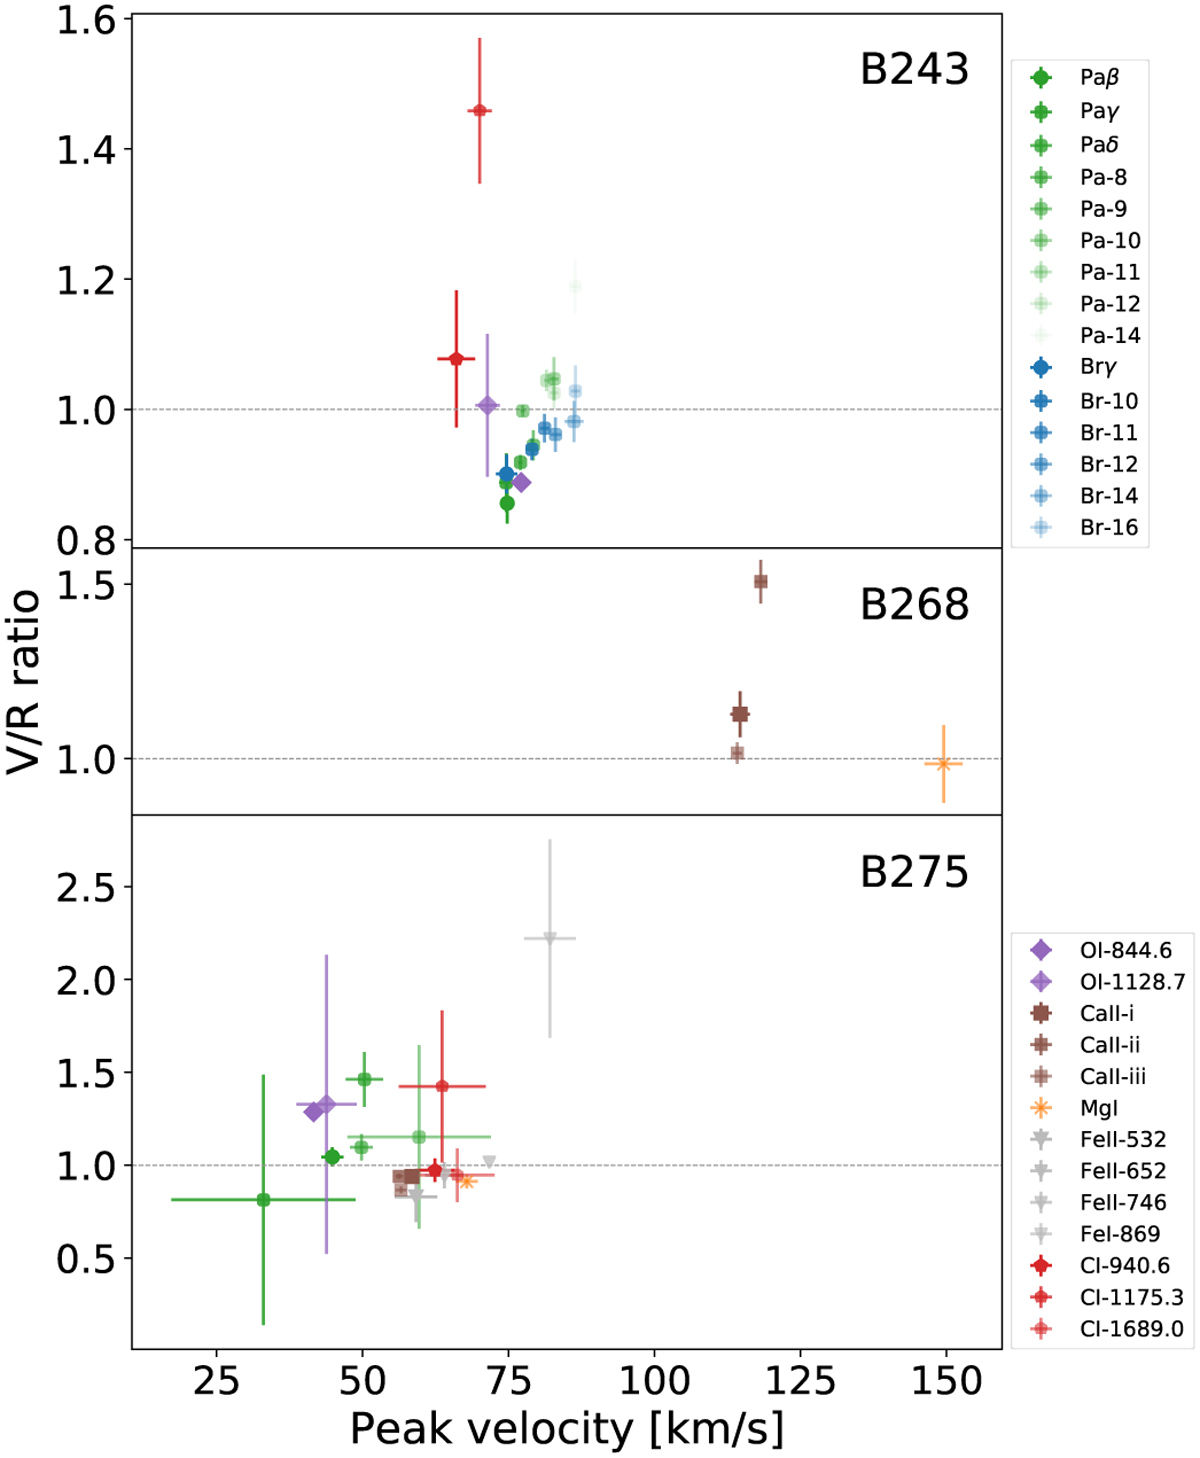
The peak velocity (half the peak-to-peak velocity) of all double-peaked emission lines in B243, B268, and B275 is plotted against their V/R ratios. The data points represent the line properties in one epoch of each star. The emission lines in a single epoch of a star have different V/R ratios and peak velocities. For B243 and B275, the lower excitation lines form at relatively lower velocities, hence at more slowly rotating parts of the disk, and their V/R ratios are relatively lower, meaning that their red peak is stronger than the blue, than measured for the higher excitation lines. For both stars, this results in a trend of a higher V/R ratio with a higher disk velocity. The displayed epochs are for B243: 2012-07-06, B268: 2019-05-31, and B275: 2019-07-09.
Current usage metrics show cumulative count of Article Views (full-text article views including HTML views, PDF and ePub downloads, according to the available data) and Abstracts Views on Vision4Press platform.
Data correspond to usage on the plateform after 2015. The current usage metrics is available 48-96 hours after online publication and is updated daily on week days.
Initial download of the metrics may take a while.