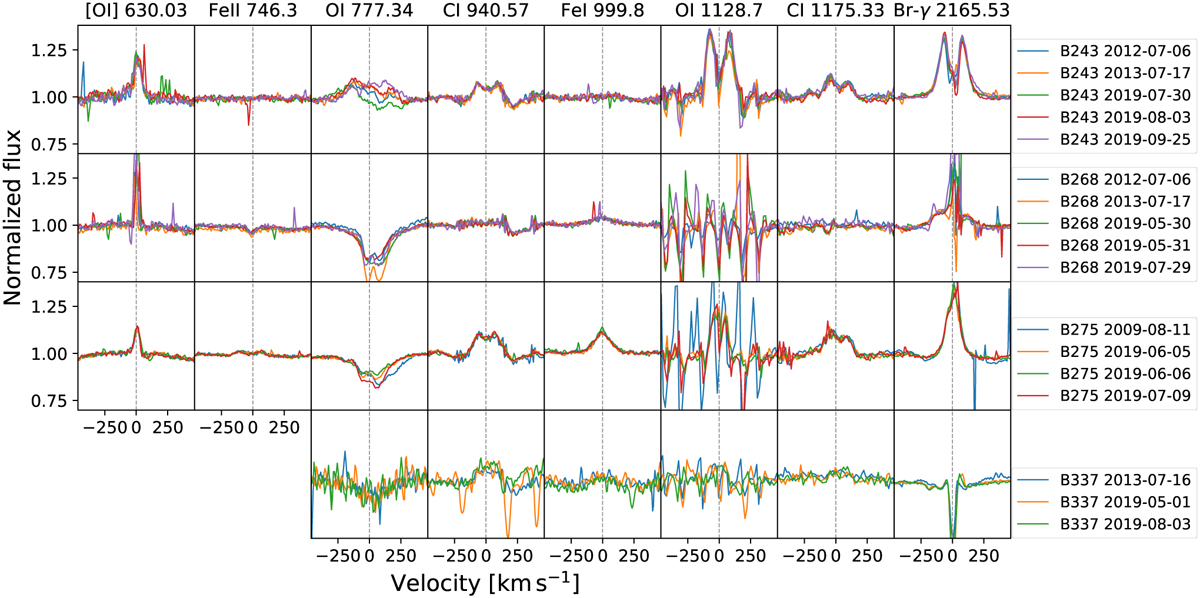
Fig. 7
Download original image
Overview of O I, [O I], Fe I, Fe II, C I, and Br-γ lines in B243, B268, B275, and B337. The multiple epochs are overplotted, and the wavelengths are shown above each panel in nm. The [O I] and Fe II lines of B337 are not shown because the bluer part of the X-shooter spectrum is too noisy. All stars display some nebular emission (residuals) on the Br-γ emission (right panel). The variability between the epochs is discussed in Sect. 7.
Current usage metrics show cumulative count of Article Views (full-text article views including HTML views, PDF and ePub downloads, according to the available data) and Abstracts Views on Vision4Press platform.
Data correspond to usage on the plateform after 2015. The current usage metrics is available 48-96 hours after online publication and is updated daily on week days.
Initial download of the metrics may take a while.