Fig. 6
Download original image
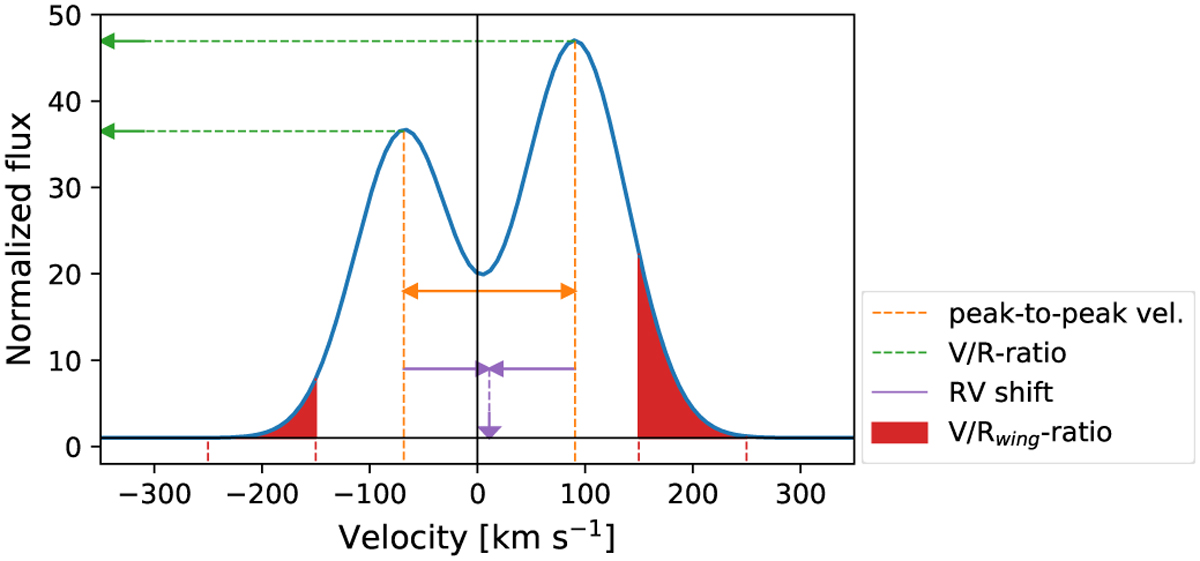
Diagram showing the four diagnostics used to infer (variability) properties of double-peaked emission lines. The peak-to-peak velocity corresponds to the velocity difference between the central velocities of the two peaks (orange). The heights of the peaks are divided to obtain the V/R ratio (green). The difference between the middle of the central peaks and the rest wavelength gives a central wavelength shift or radial velocity shift (purple). The equivalent width of this line is determined between −250 and −150 km s−1 and between 150 and 250 km s−1 (red). The (V/R)wing ratio is the ratio of these values.
Current usage metrics show cumulative count of Article Views (full-text article views including HTML views, PDF and ePub downloads, according to the available data) and Abstracts Views on Vision4Press platform.
Data correspond to usage on the plateform after 2015. The current usage metrics is available 48-96 hours after online publication and is updated daily on week days.
Initial download of the metrics may take a while.