Fig. E.3
Download original image
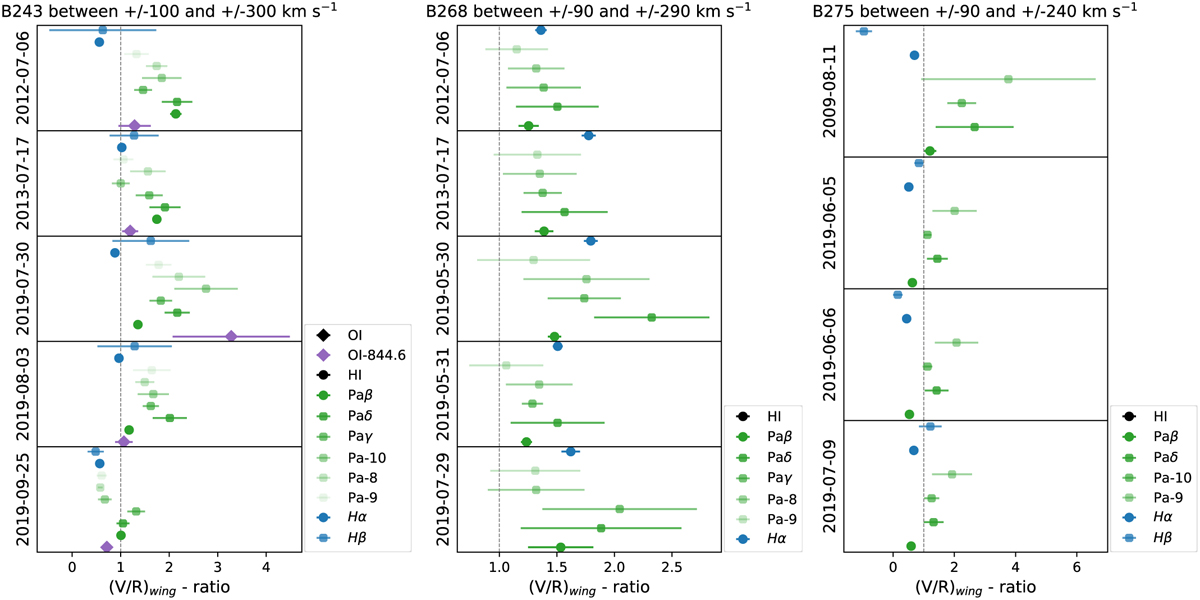
(V/R)wing ratio measurements of the double-peaked emission features after subtracting a star model shown on the x-axis. The observation date is plotted on the y-axis. In the left panel for B243, the EW is determined between ±100 km s−1 and ±300 km s−1; in the middle panel for B268, it is between ±90 km s−1 and ±290 km s−1, and in the right panel for B275, it is between ±90 km s−1 and ±240 km s−1.
Current usage metrics show cumulative count of Article Views (full-text article views including HTML views, PDF and ePub downloads, according to the available data) and Abstracts Views on Vision4Press platform.
Data correspond to usage on the plateform after 2015. The current usage metrics is available 48-96 hours after online publication and is updated daily on week days.
Initial download of the metrics may take a while.