Fig. E.2
Download original image
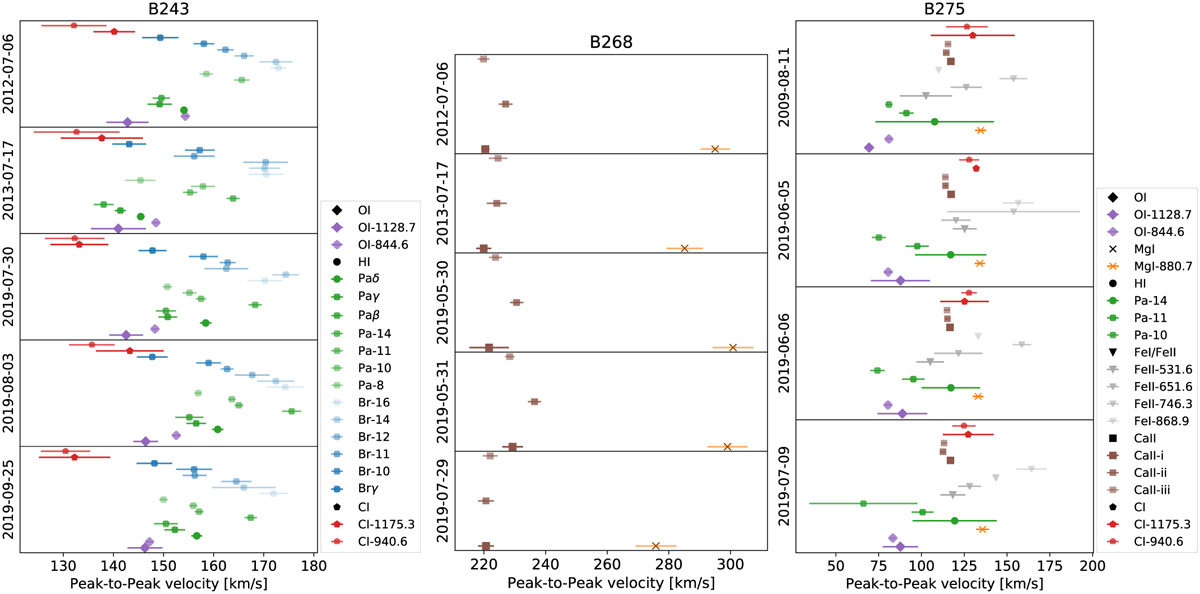
Peak-to-peak velocity of the double-peaked emission lines in the spectra of B243, B268, and B275 is shown on the x-axis, and the date of observation is plotted on the y-axis. The peaks are measured after subtracting the stellar feature by a double-Gaussian fit. The velocities in B243 (left figure) range between 130 km s−1 and 180 km s−1, and there is a general trend in velocity over the five epochs, which is most apparent for all lines in the last three epochs. In B268 (middle panel), the velocities range between 220km s−1 and 300 km s−1, and the velocity difference is 65 km s−1 between the Ca II triplet and Mg I peak-to-peak velocities (the legend of B275 can also be used to read the middle panel). The velocities in B275 (right panel) range from 70 km s−1 to 165 km s−1.
Current usage metrics show cumulative count of Article Views (full-text article views including HTML views, PDF and ePub downloads, according to the available data) and Abstracts Views on Vision4Press platform.
Data correspond to usage on the plateform after 2015. The current usage metrics is available 48-96 hours after online publication and is updated daily on week days.
Initial download of the metrics may take a while.