Fig. 17
Download original image
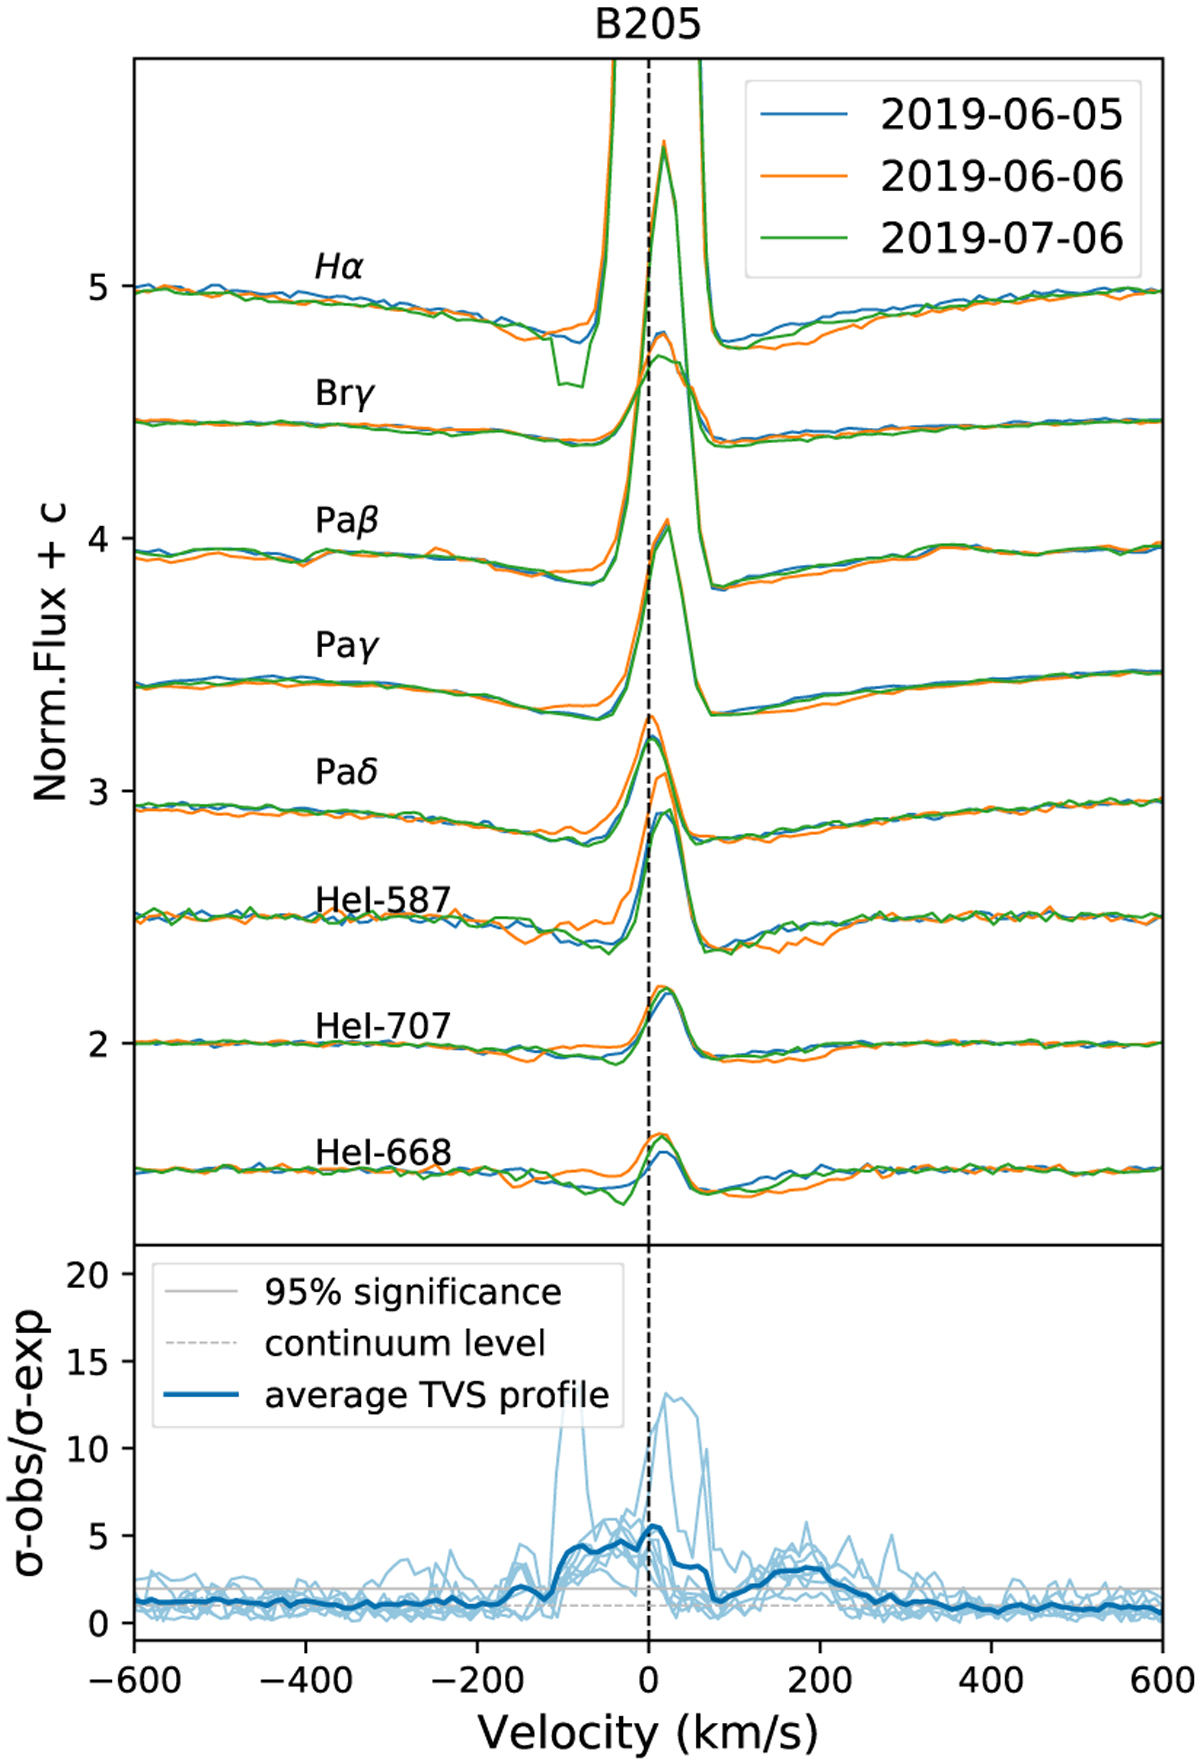
Line profiles and TVS of B205. The upper panel shows the Balmer, Paschen, Bracket, and helium lines in several spectra of B205 taken in 2019. The lower panel shows the TVS of these spectra, indicating a significant velocity range between −150 km s−1 and 220 km s−1. The variations in the spectra appear to be strongest in the helium lines. The emission around the rest wavelength of the features is of nebular origin, as confirmed by their 2D spectra.
Current usage metrics show cumulative count of Article Views (full-text article views including HTML views, PDF and ePub downloads, according to the available data) and Abstracts Views on Vision4Press platform.
Data correspond to usage on the plateform after 2015. The current usage metrics is available 48-96 hours after online publication and is updated daily on week days.
Initial download of the metrics may take a while.