Fig. 15
Download original image
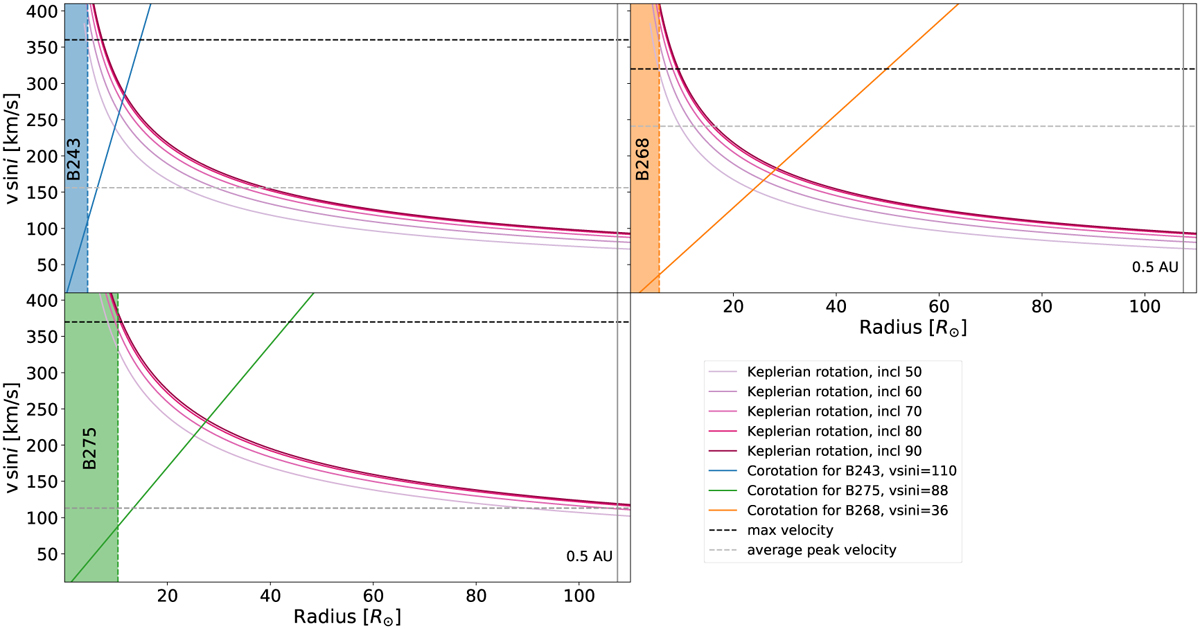
Projected radial velocity profiles for various models. The left filled-in region in each panel denotes the stellar size. Two velocity-distance relations are plotted: 1. Corotation with the stellar surface, where the velocity increases away from the star, and 2. Keplerian rotation for several inclinations, where the velocity increases towards the star. The striped lines present the maximum Hα velocity detected in the disk (in black), determined by the extent of the variability, and the Ha velocity determined by the average of half of the peak-to-peak velocity (in gray).
Current usage metrics show cumulative count of Article Views (full-text article views including HTML views, PDF and ePub downloads, according to the available data) and Abstracts Views on Vision4Press platform.
Data correspond to usage on the plateform after 2015. The current usage metrics is available 48-96 hours after online publication and is updated daily on week days.
Initial download of the metrics may take a while.