Fig. 14
Download original image
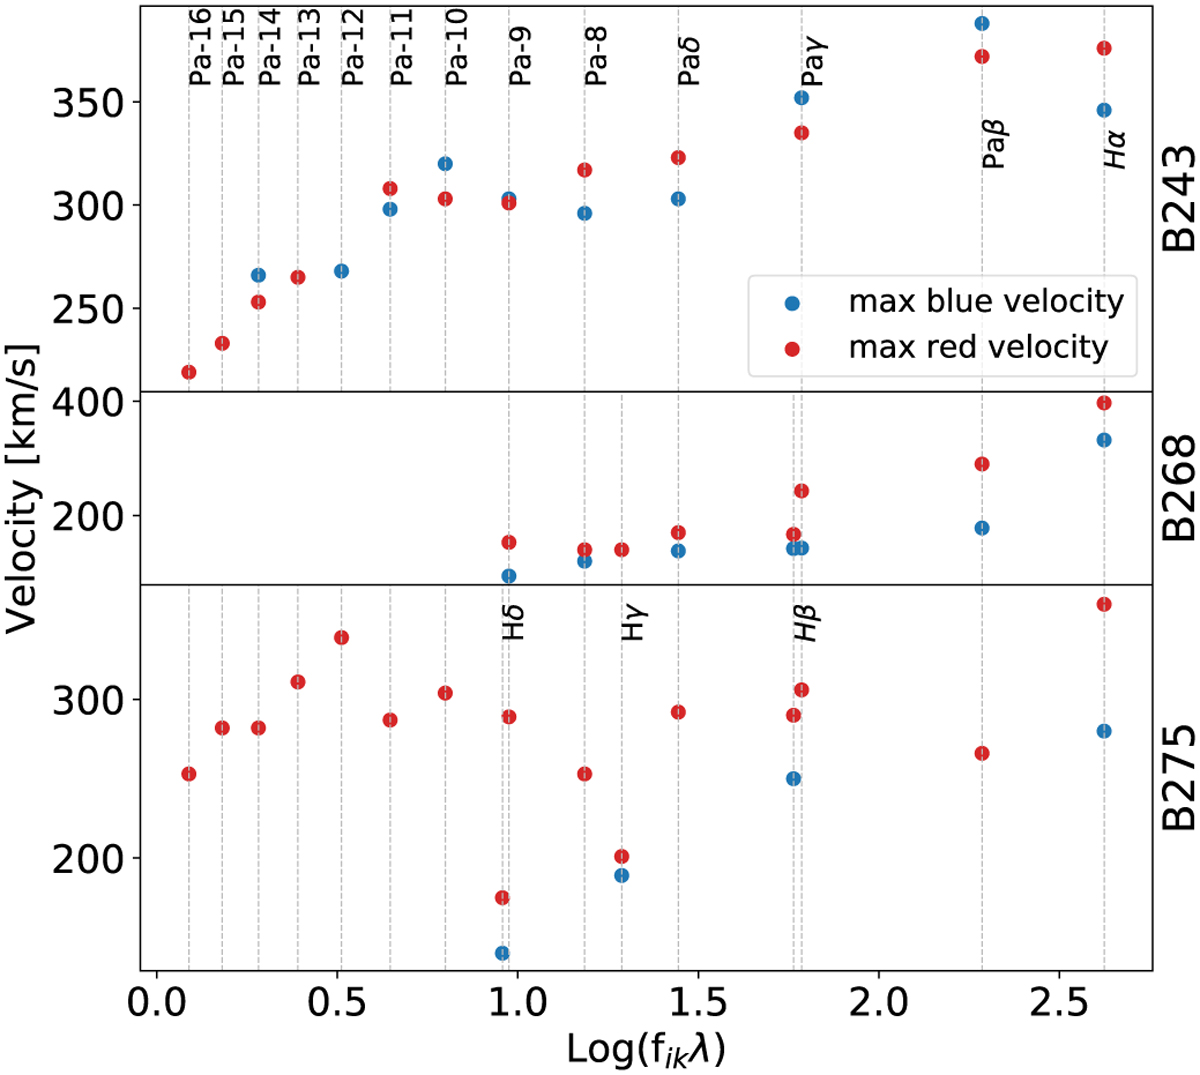
Maximum velocity at which significant variation is observed in the TVS (over all epochs) for each star, plotted against the oscillator strength times the wavelength. The maximum velocities are determined on the red and blue side of the features. We plot the absolute blue-side velocity for convenience. The blue velocities of the Paschen lines of B275 are not shown because they do not display variability at high velocities, which makes them indistinguishable from nebular subtraction residuals (which range from ~50–80 km s−1).
Current usage metrics show cumulative count of Article Views (full-text article views including HTML views, PDF and ePub downloads, according to the available data) and Abstracts Views on Vision4Press platform.
Data correspond to usage on the plateform after 2015. The current usage metrics is available 48-96 hours after online publication and is updated daily on week days.
Initial download of the metrics may take a while.