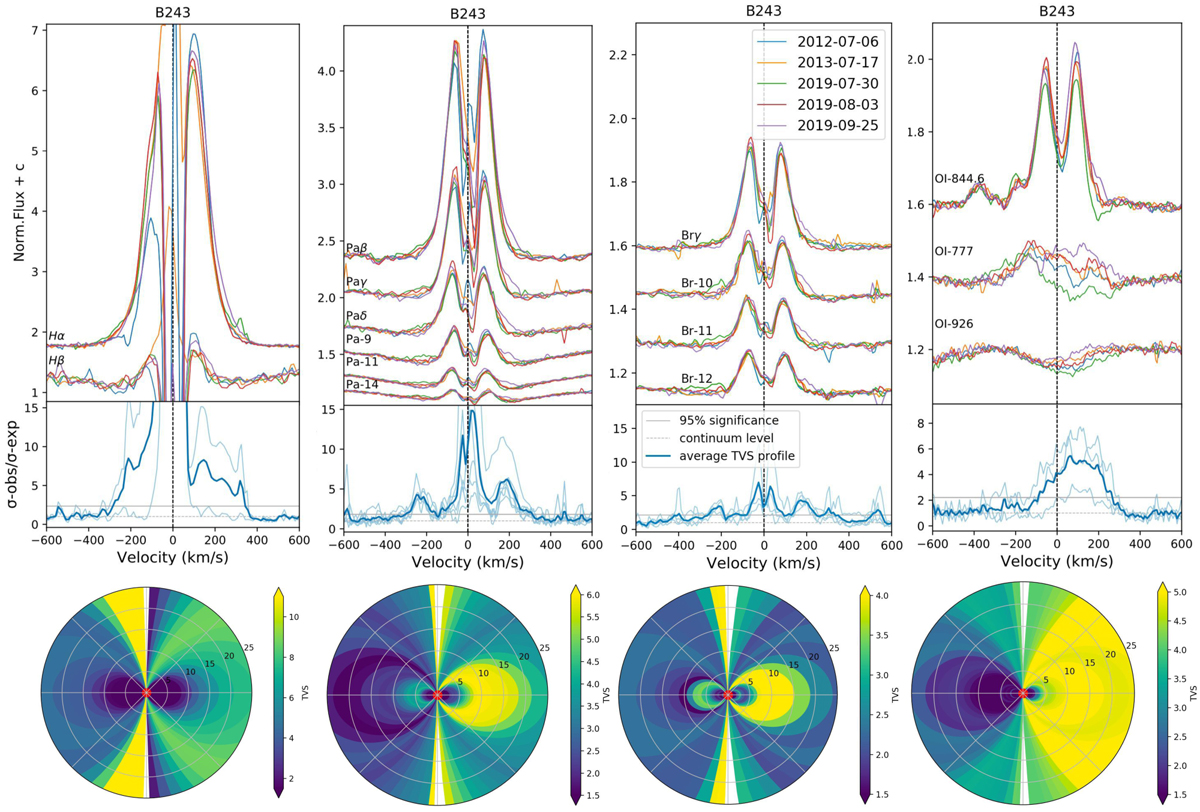
Fig. 10
Download original image
TVS and disk maps for B243. The emission lines in B243 that display variability are shown in the upper panel (first row). The middle panel displays the TVS for each emission line (light blue) and an average profile (dark blue) calculated for each series of lines is displayed in the upper panel. The variations at the line center of the H I lines are residuals from the nebular subtraction. The TVS panel shows the continuum level as a dotted line at unity, and a gray line marking the level at which variations reach the 95% significance level. The average TVSs in the lower panels in each column are mapped onto the circles in the bottom row. They show a face-on disk view, where the TVS is mapped according to their velocity bins. The gray circles and accompanying numbers are in units of the stellar radius. The white areas are the result of the disk projection and do not have any physical meaning.
Current usage metrics show cumulative count of Article Views (full-text article views including HTML views, PDF and ePub downloads, according to the available data) and Abstracts Views on Vision4Press platform.
Data correspond to usage on the plateform after 2015. The current usage metrics is available 48-96 hours after online publication and is updated daily on week days.
Initial download of the metrics may take a while.