Fig. 1
Download original image
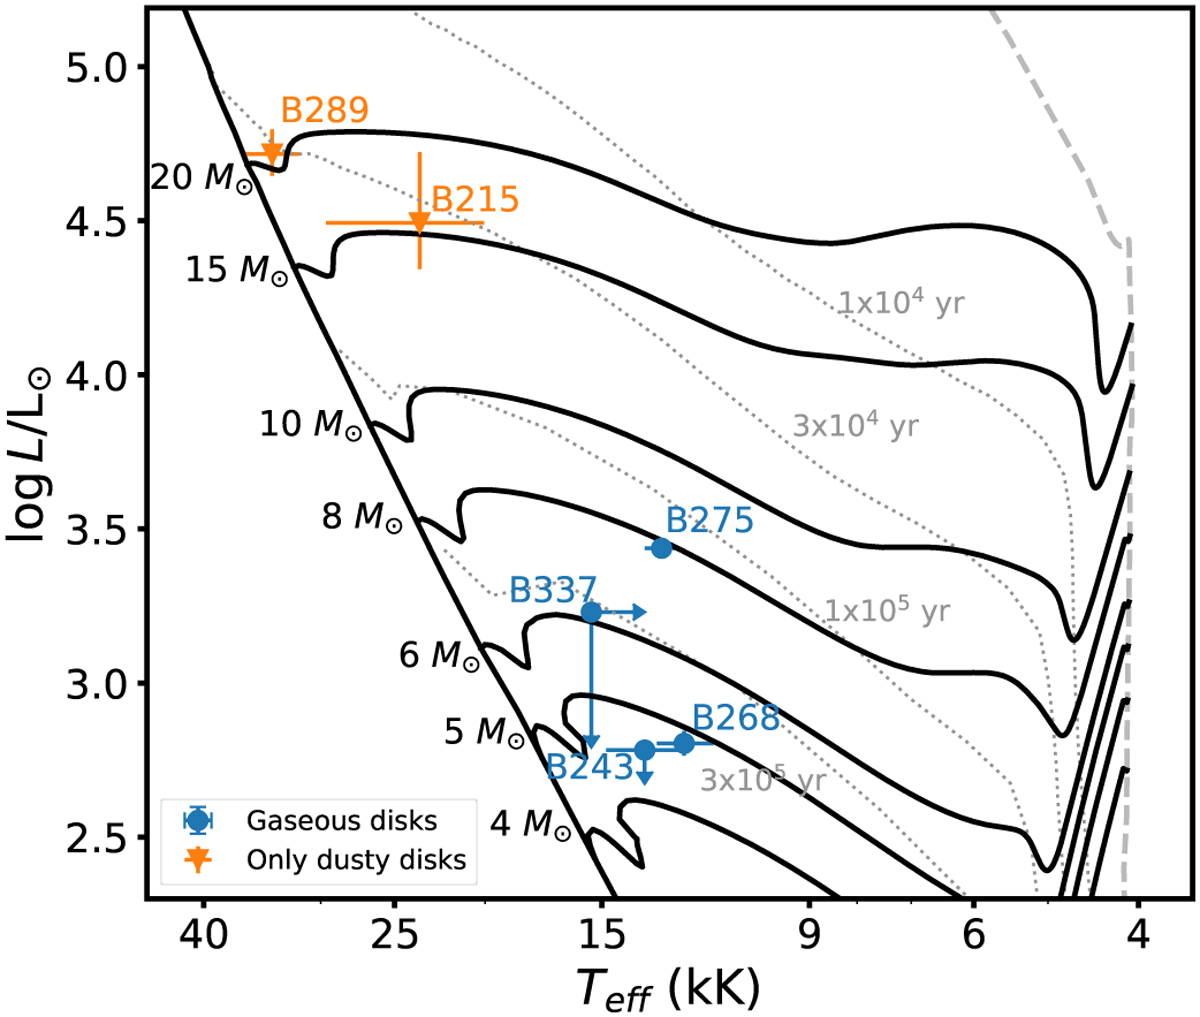
Hertzsprung-Russell diagram of the stars in M17 with PMS evolutionary tracks from MIST (solid black lines; Dotter 2016; Choi et al. 2016; Paxton et al. 2011, 2013, 2015). The blue dots represent the PMS stars with IR excess and emission lines in their X-shooter spectrum. The orange triangles represent the PMS stars without emission lines in the X-shooter spectrum, but with IR excess λ > 2.3 µm (Chini et al. 2005). The gray striped line is the birth line, and the straight black line to the left of the figure is the ZAMS. The dotted gray lines show the isochrones. The ages are indicated in a similar color in the figure.
Current usage metrics show cumulative count of Article Views (full-text article views including HTML views, PDF and ePub downloads, according to the available data) and Abstracts Views on Vision4Press platform.
Data correspond to usage on the plateform after 2015. The current usage metrics is available 48-96 hours after online publication and is updated daily on week days.
Initial download of the metrics may take a while.