Fig. 9
Download original image
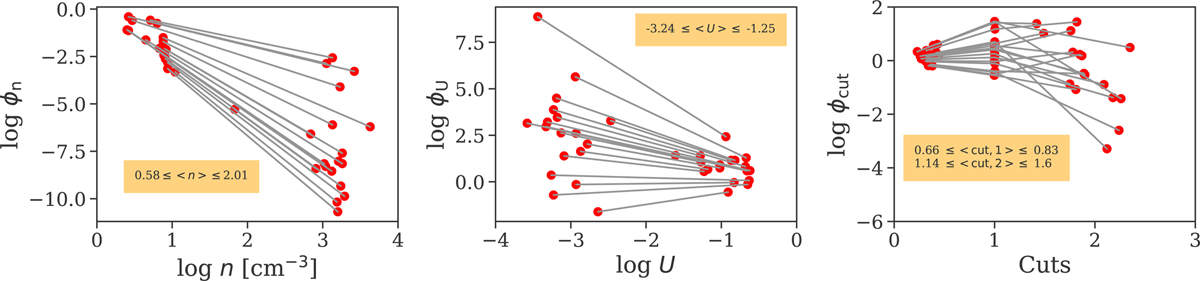
Values of the power-law parameters for individual galaxies controlling the density (left), ionization parameter (middle), and cut (right) for each galaxy. The red dots correspond to the means of the lower and upper boundaries of power laws (and pivot point for the broken power law) and the gray lines represent the power laws corresponding to the averages slope values, for each galaxy.
Current usage metrics show cumulative count of Article Views (full-text article views including HTML views, PDF and ePub downloads, according to the available data) and Abstracts Views on Vision4Press platform.
Data correspond to usage on the plateform after 2015. The current usage metrics is available 48-96 hours after online publication and is updated daily on week days.
Initial download of the metrics may take a while.