Fig. 8
Download original image
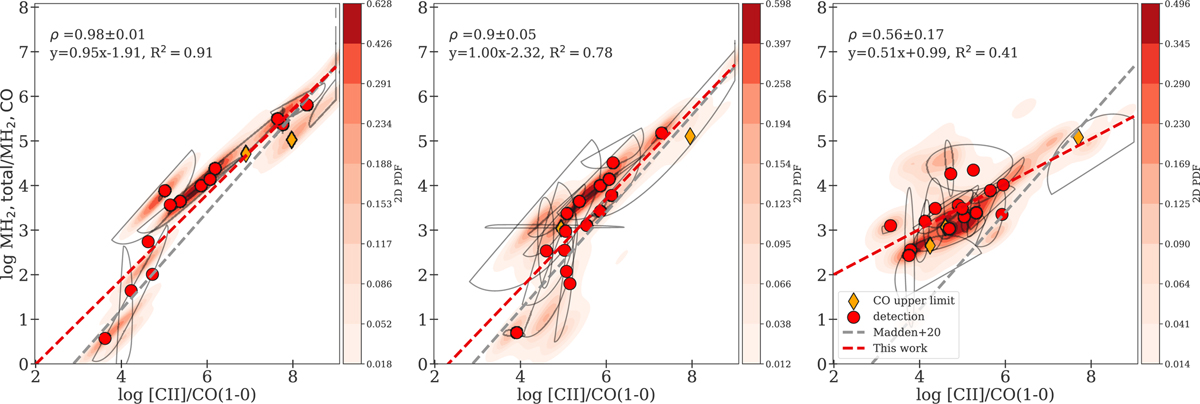
MH2,total/MH2,CO versus [C II]/CO(l–0) for single component models (left), multi-component models (middle), and power law models (right). The shades and symbols are described in Fig. 4. The dashed gray lines corresponds to the relation from M2O while the dashed red lines show the linear regressions fitted to the combined posterior distribution for the entire sample. We indicate the equations of linear regressions fitted to the 2D-PDF of the whole sample and the associated coefficients of determination R2.
Current usage metrics show cumulative count of Article Views (full-text article views including HTML views, PDF and ePub downloads, according to the available data) and Abstracts Views on Vision4Press platform.
Data correspond to usage on the plateform after 2015. The current usage metrics is available 48-96 hours after online publication and is updated daily on week days.
Initial download of the metrics may take a while.