Fig. 4
Download original image
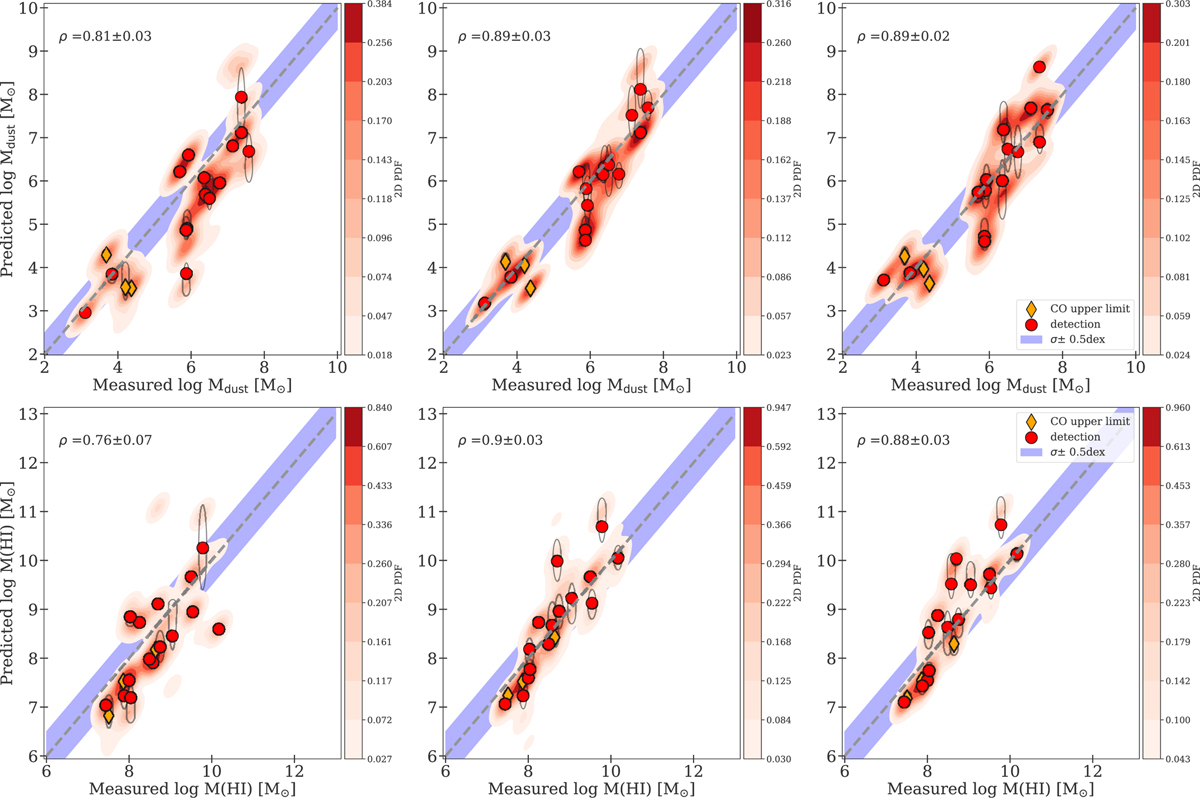
Dust and H I masses predicted by single component (left), multi-component (middle), and power law models (right). The red points mark the location of robust means and the ellipses the 1σ uncertainty around the main peak, following the skewed uncertainty ellipses formalism described in Galliano et al. (2021). We report the mean and standard deviation of the Spearman correlation coefficients (ρ) calculated for of the whole sample, at each of the MCMC steps, represented by the shaded kernel density estimate underlying data points. The dashed lines indicate the 1:1 relation and the blue shaded area a deviation of 0.5 dex around the latter relation.
Current usage metrics show cumulative count of Article Views (full-text article views including HTML views, PDF and ePub downloads, according to the available data) and Abstracts Views on Vision4Press platform.
Data correspond to usage on the plateform after 2015. The current usage metrics is available 48-96 hours after online publication and is updated daily on week days.
Initial download of the metrics may take a while.