Open Access
Fig. 3
Download original image
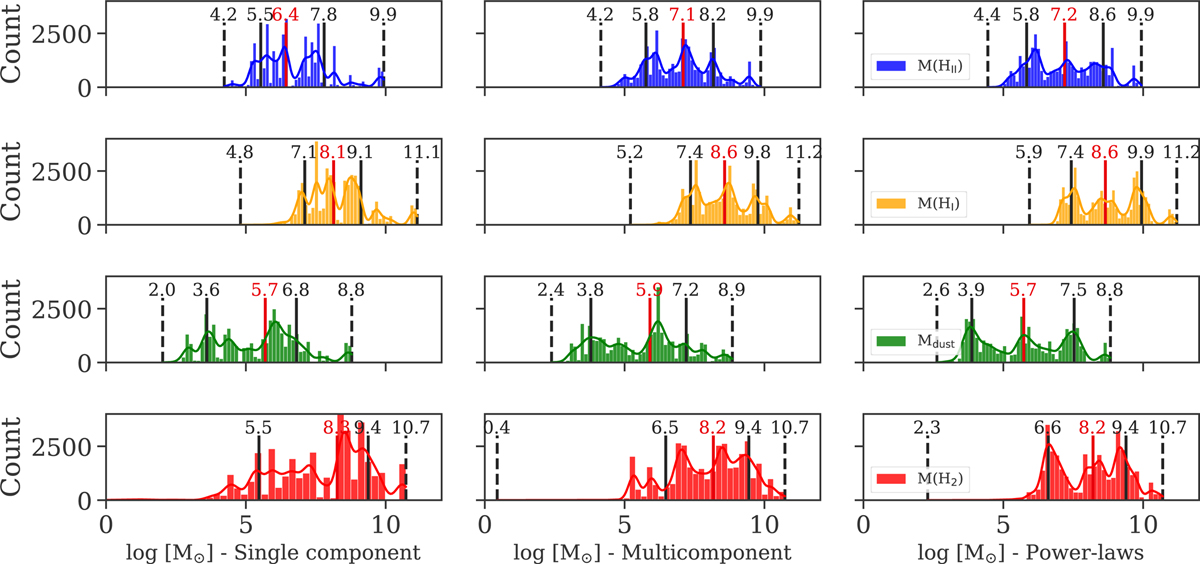
Comparison of the H II, H I, and H2 masses for different architectures. The histograms are built using the MCMC draws for the whole sample. The vertical lines show the minima and maxima of the distributions (dashed lines), the quantiles at 15% and 85% (plain black lines), and the median value (plain red line).
Current usage metrics show cumulative count of Article Views (full-text article views including HTML views, PDF and ePub downloads, according to the available data) and Abstracts Views on Vision4Press platform.
Data correspond to usage on the plateform after 2015. The current usage metrics is available 48-96 hours after online publication and is updated daily on week days.
Initial download of the metrics may take a while.