Fig. 14
Download original image
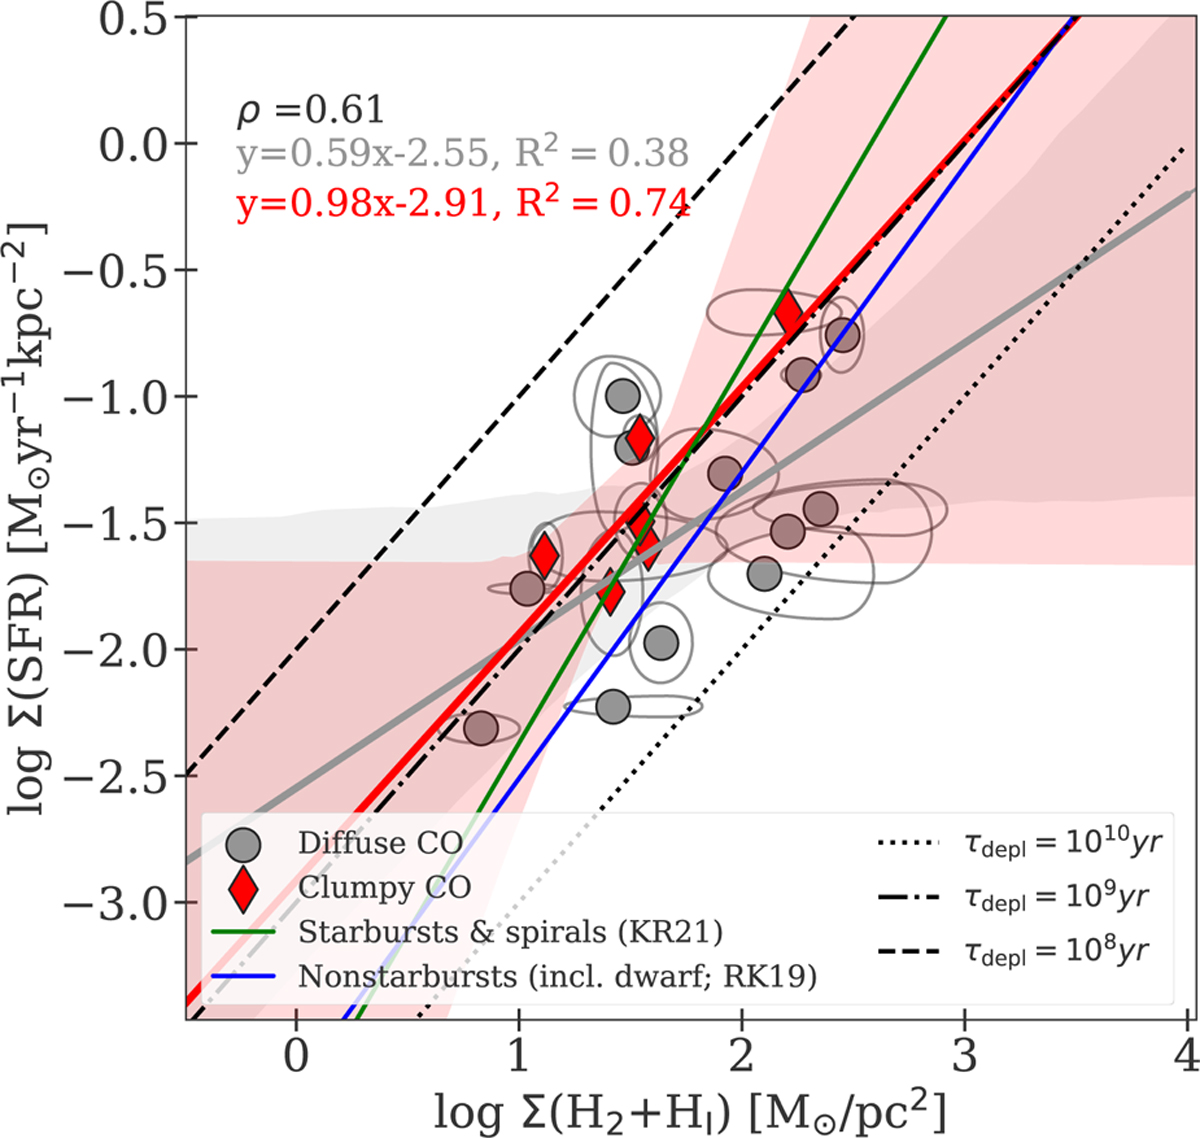
ΣSFR vs. Σ(H2+H I). The galaxies associated with a “clumpy CO” distribution are reported in bold in Table A.2 and correspond to Pclumpy ≥ 0.4 (see Eq. (11)), while the others correspond to a “diffuse CO” distribution. Plain lines correspond to the best fits obtained for those two categories, with their 95% confidence intervals shown as shaded-areas, as well as the relations derived for starbursting galaxies and non-starbursting galaxies from Kennicutt & De Los Reyes (2021) and de los Reyes & Kennicutt (2019), respectively.
Current usage metrics show cumulative count of Article Views (full-text article views including HTML views, PDF and ePub downloads, according to the available data) and Abstracts Views on Vision4Press platform.
Data correspond to usage on the plateform after 2015. The current usage metrics is available 48-96 hours after online publication and is updated daily on week days.
Initial download of the metrics may take a while.