Fig. 13
Download original image
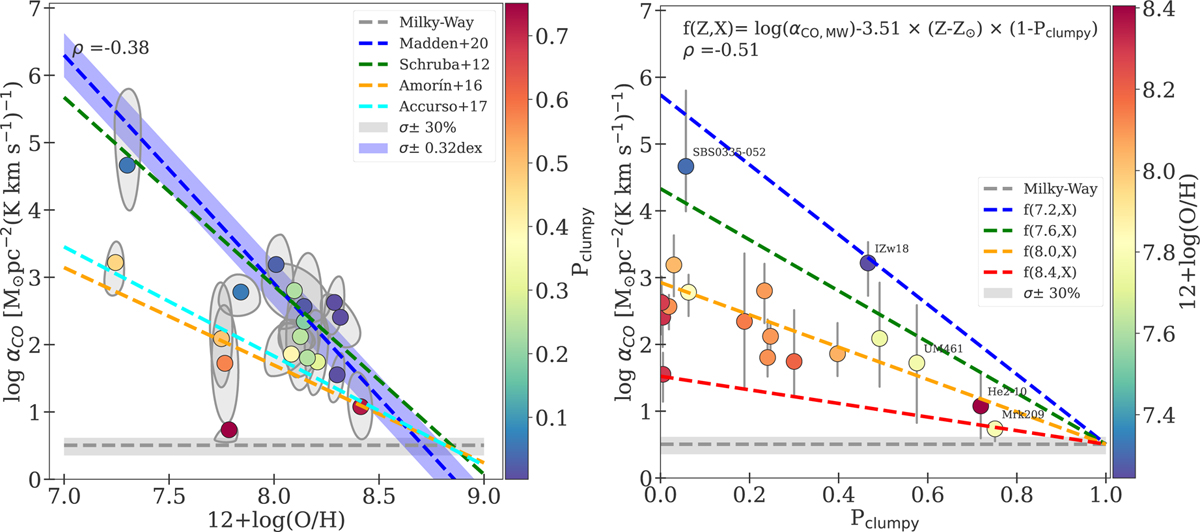
Relation between the αCO vs. the gas-phase metallicity (left panel) and the clumpiness parameter (right panel), defined by Eq. (11). The Spearman correlation coefficients are calculated for the means of individual galaxies, shown by colored dots. We show the Galactic αCO value from B13 and the range of values compatible with it within 30% (gray-shaded area).
Current usage metrics show cumulative count of Article Views (full-text article views including HTML views, PDF and ePub downloads, according to the available data) and Abstracts Views on Vision4Press platform.
Data correspond to usage on the plateform after 2015. The current usage metrics is available 48-96 hours after online publication and is updated daily on week days.
Initial download of the metrics may take a while.