Fig. 1
Download original image
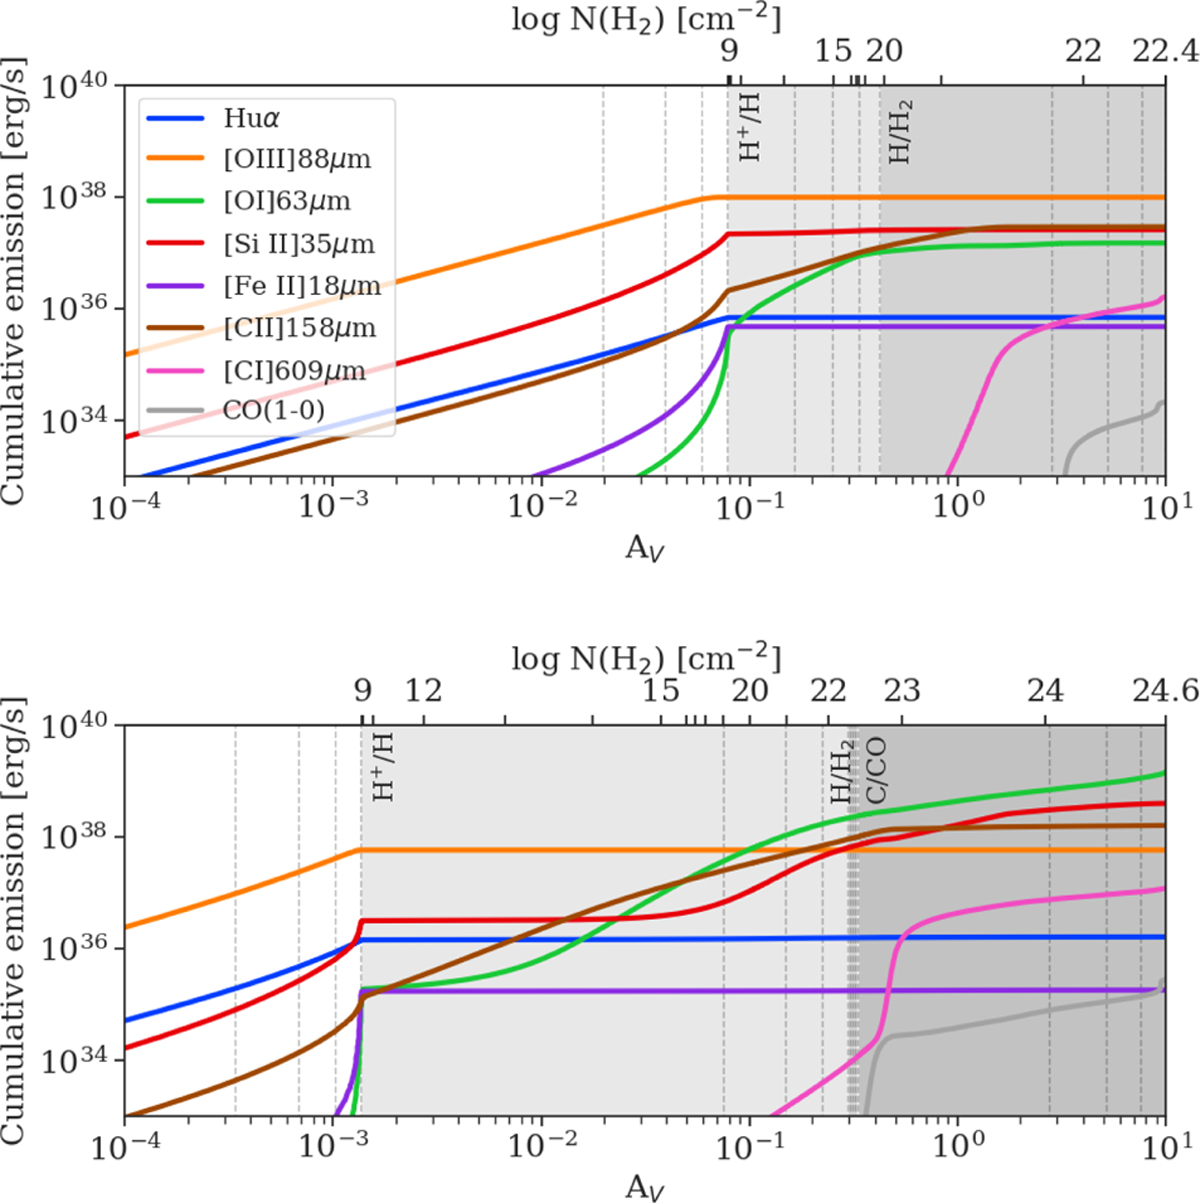
Cumulative emission lines profiles of some chosen tracers as a function of the visual extinction AV, for two models drawn from the SFGX grid. Both models are computed with a density at the illuminated edge of 100 cm−2, an ionization parameter at the illuminated edge U = 10−2, an instantaneous stellar burst of 3 Myr computed with BPASS stellar atmospheres (Eldridge et al. 2017), and no X-ray source. The top row shows a solar metallicity model, while the bottom row shows amodel with Z = 1/10 Z⊙ and Zdust = 1/155 Zdust,⊙, following the prescription from Sect. 3.1.4. The shaded areas mark the location of the PDR (light gray) and molecular zone (dark gray). The vertical dashed lines show the cuts considered for each model. We note that the C/CO transition is not visible in the first panel since it occurs after AV = 10.
Current usage metrics show cumulative count of Article Views (full-text article views including HTML views, PDF and ePub downloads, according to the available data) and Abstracts Views on Vision4Press platform.
Data correspond to usage on the plateform after 2015. The current usage metrics is available 48-96 hours after online publication and is updated daily on week days.
Initial download of the metrics may take a while.