Fig. 1
Download original image
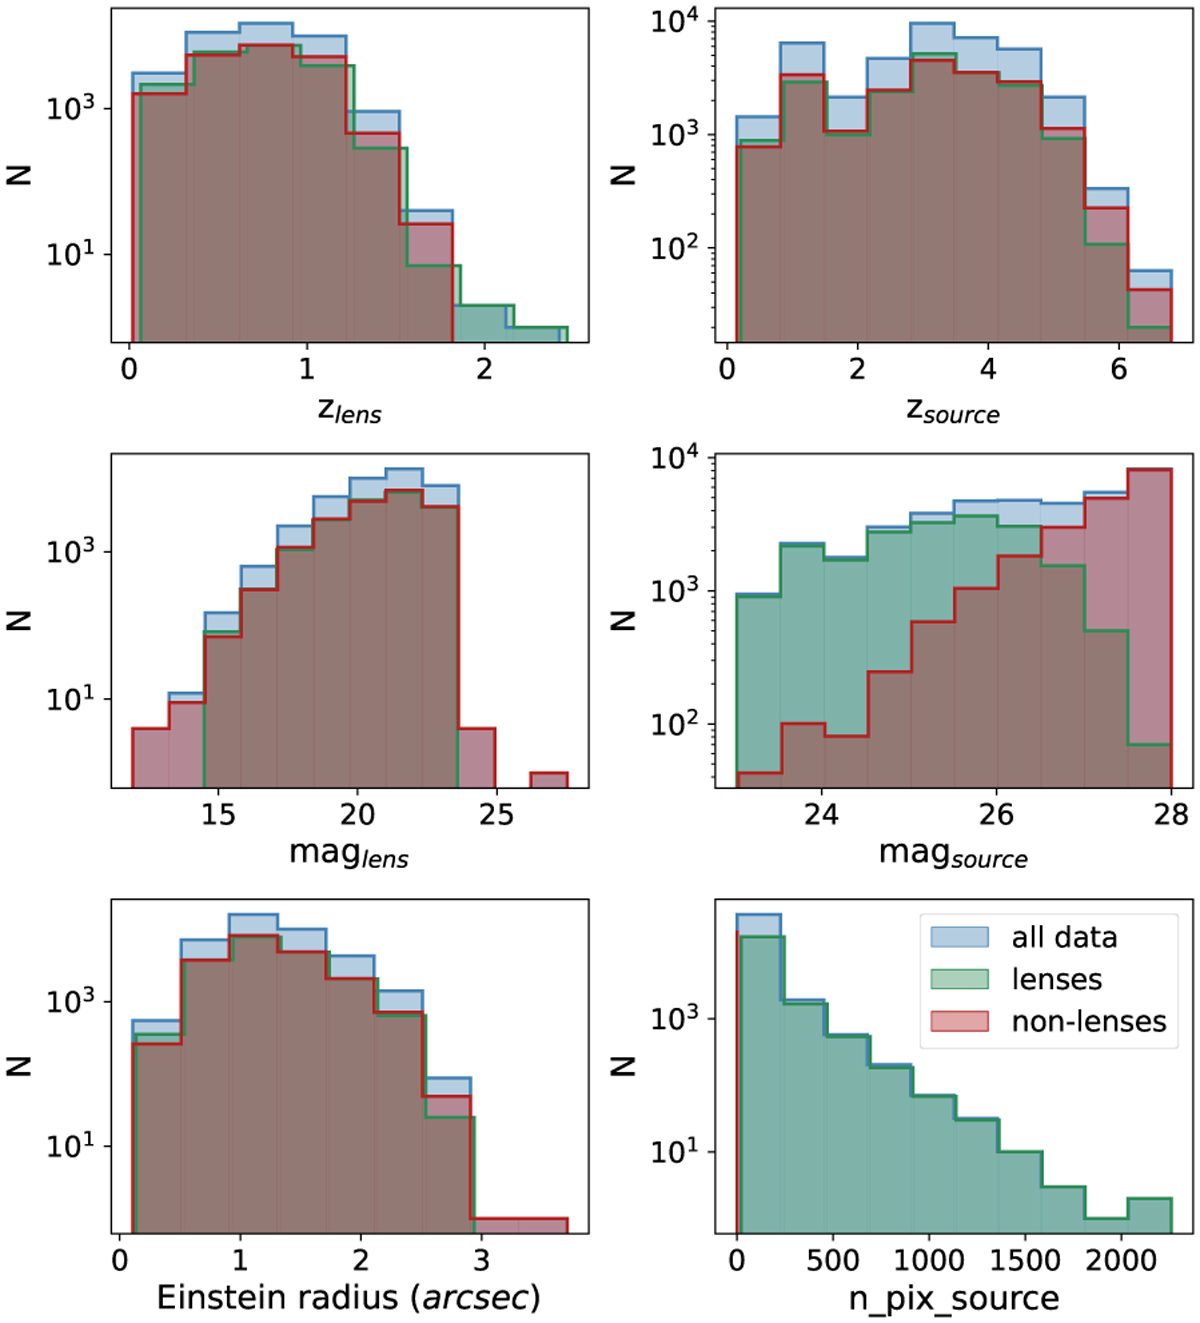
Distribution of several properties of the simulated images in the data set (blue histograms) selected for training, which consisted of 40 000 mocks in total. The distributions of the same properties in the separate subsets of lenses and nonlenses are given by the green and red histograms, respectively. In the panels in the upper and middle rows, we show the distributions of lens and source redshiſts and IE band magnitudes (in the case of the sources, we refer to the intrinsic magnitude). The bottom panels show the distributions of Einstein radii of the lenses and of the number of pixels for which the source brightness exceeds lσ above the background noise level.
Current usage metrics show cumulative count of Article Views (full-text article views including HTML views, PDF and ePub downloads, according to the available data) and Abstracts Views on Vision4Press platform.
Data correspond to usage on the plateform after 2015. The current usage metrics is available 48-96 hours after online publication and is updated daily on week days.
Initial download of the metrics may take a while.