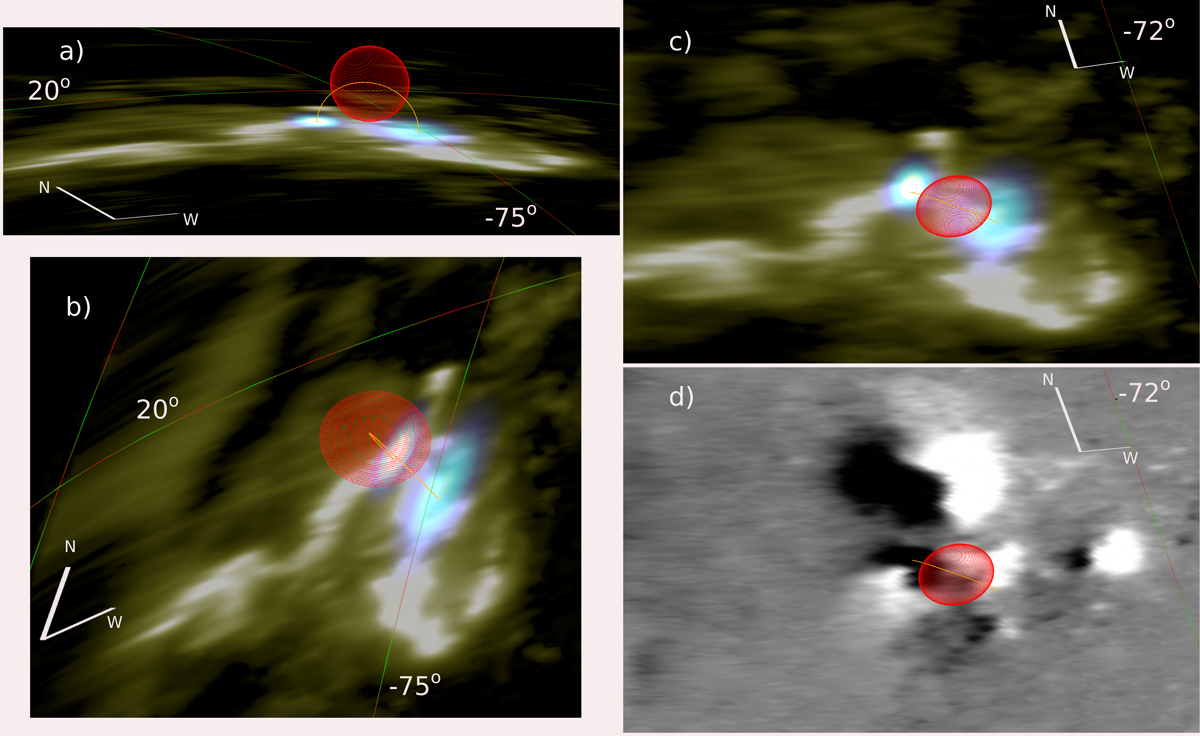
Fig. 4.

Download original image
3D reconstructions created with the observations shown in Figs. 1e,f and visualised using JHelioviewer. The thermal X-ray loop-top source of the flare (stacked red ellipses) is seen from three different viewing angles. Panels c and d show the same viewing angle and field of view. The thermal X-ray source is overlaid on a reprojected AIA 1600 Å image (green, panels a–c) and HMI magnetogram (black/white, panel d). Panels a–c also show elliptical forward-fit STIX images of the non-thermal flare footpoints (blue) as seen in 22–50 keV. The orange line in all panels is a semi-ellipse drawn between the footpoints through the centre of the thermal source as an approximation of the flare loops. The X-ray footpoint sources are omitted from panel d to give a clearer view of the magnetogram, but their locations can be inferred from the ends of the orange loop. For reference, the green and red lines show the heliocentric Stonyhurst lines of latitude and longitude, and each panel shows the north-west axes in its corners.
Current usage metrics show cumulative count of Article Views (full-text article views including HTML views, PDF and ePub downloads, according to the available data) and Abstracts Views on Vision4Press platform.
Data correspond to usage on the plateform after 2015. The current usage metrics is available 48-96 hours after online publication and is updated daily on week days.
Initial download of the metrics may take a while.


