Fig. 3.

Download original image
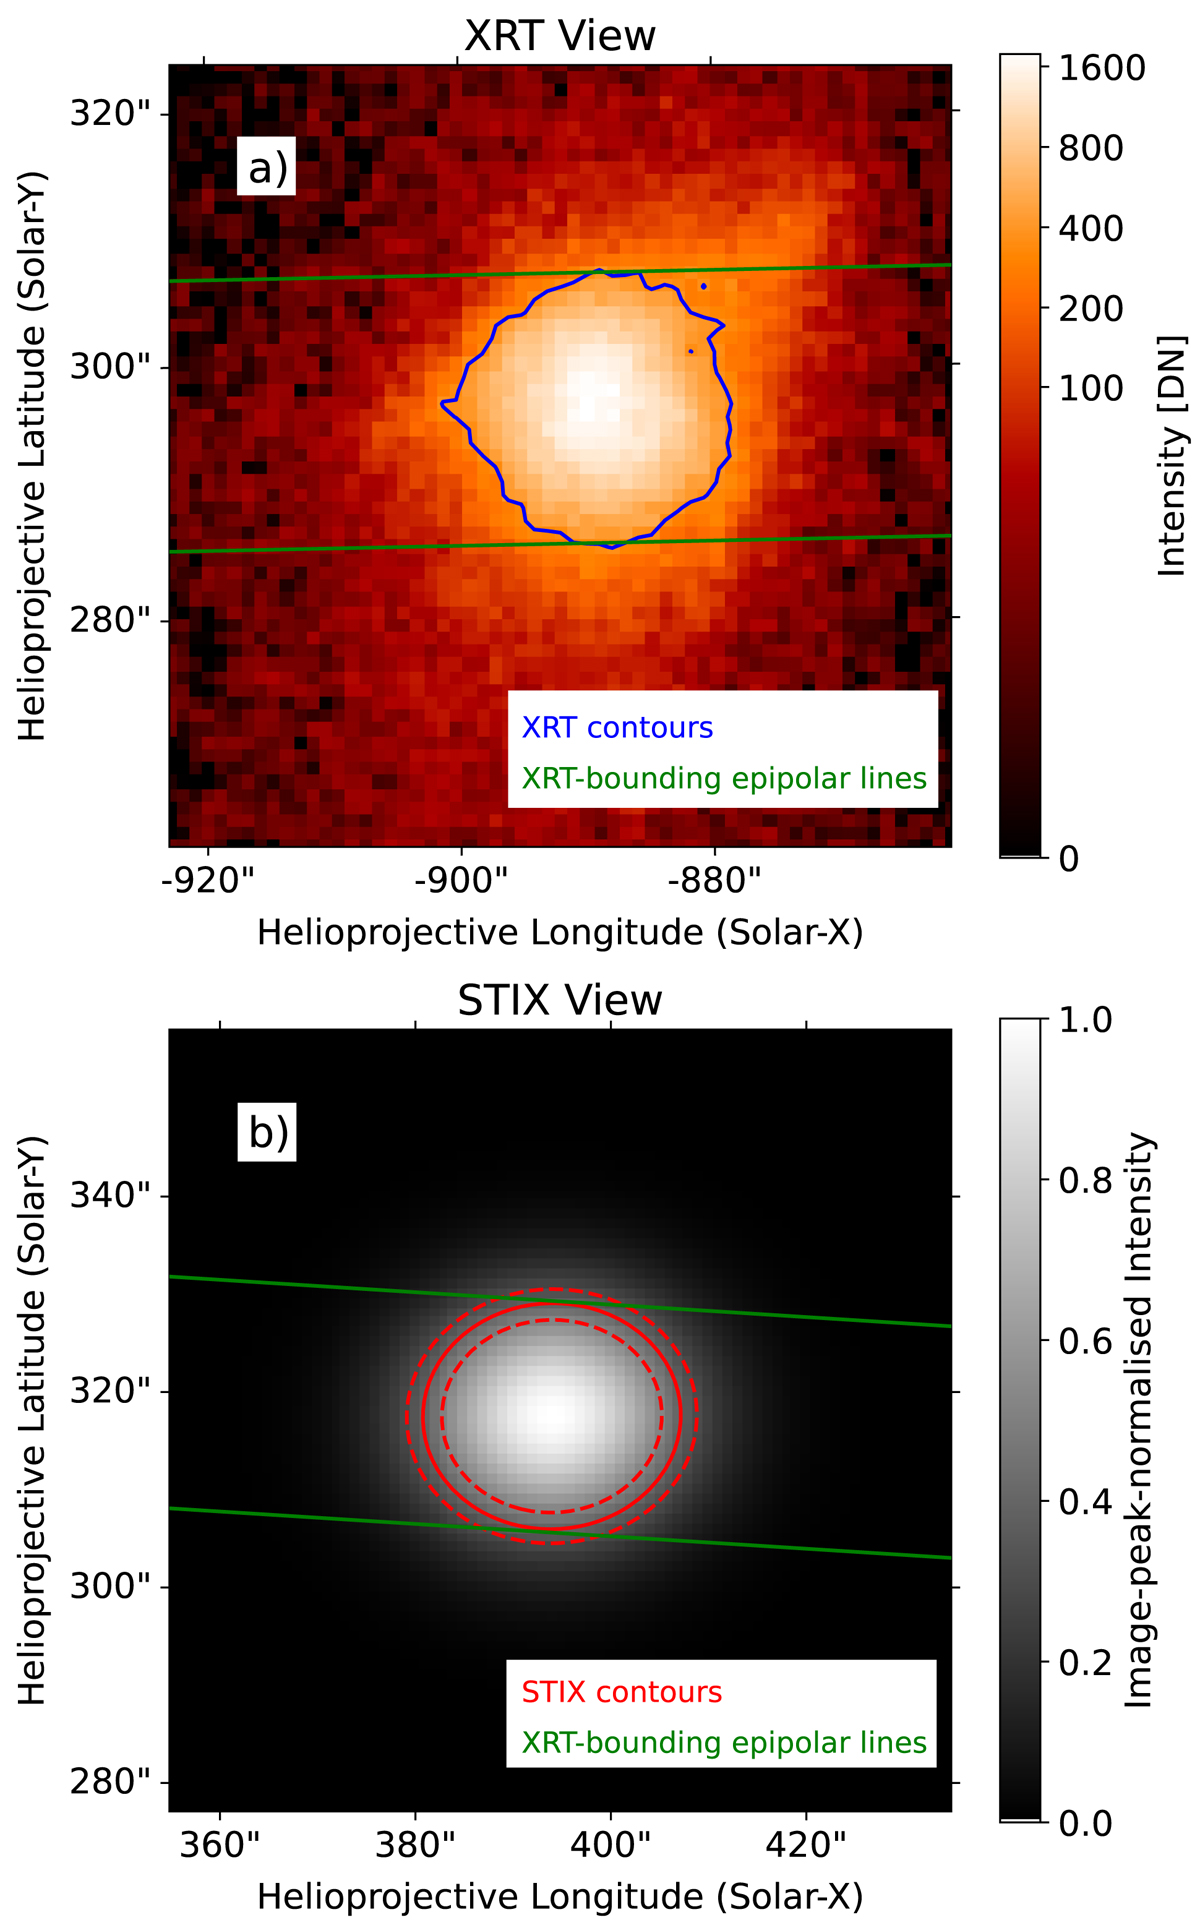
Demonstration of how XRT is used to constrain the source boundary threshold as seen by STIX. a) XRT Be-thick image showing the source boundary (blue contour; Eq. (2)) and the epipolar planes that bound it (green). b) Corresponding 6–10 keV STIX image with three source contours (inner dashed red line: 50%; solid red line: 37%, outer dashed red line: 30%) and the same epipolar planes as in panel a (green) projected to the STIX viewing angle. Only one contour (solid red) is tangent to both bounding epipolar planes and so represents the source boundary as seen by STIX.
Current usage metrics show cumulative count of Article Views (full-text article views including HTML views, PDF and ePub downloads, according to the available data) and Abstracts Views on Vision4Press platform.
Data correspond to usage on the plateform after 2015. The current usage metrics is available 48-96 hours after online publication and is updated daily on week days.
Initial download of the metrics may take a while.


