Fig. 2.

Download original image
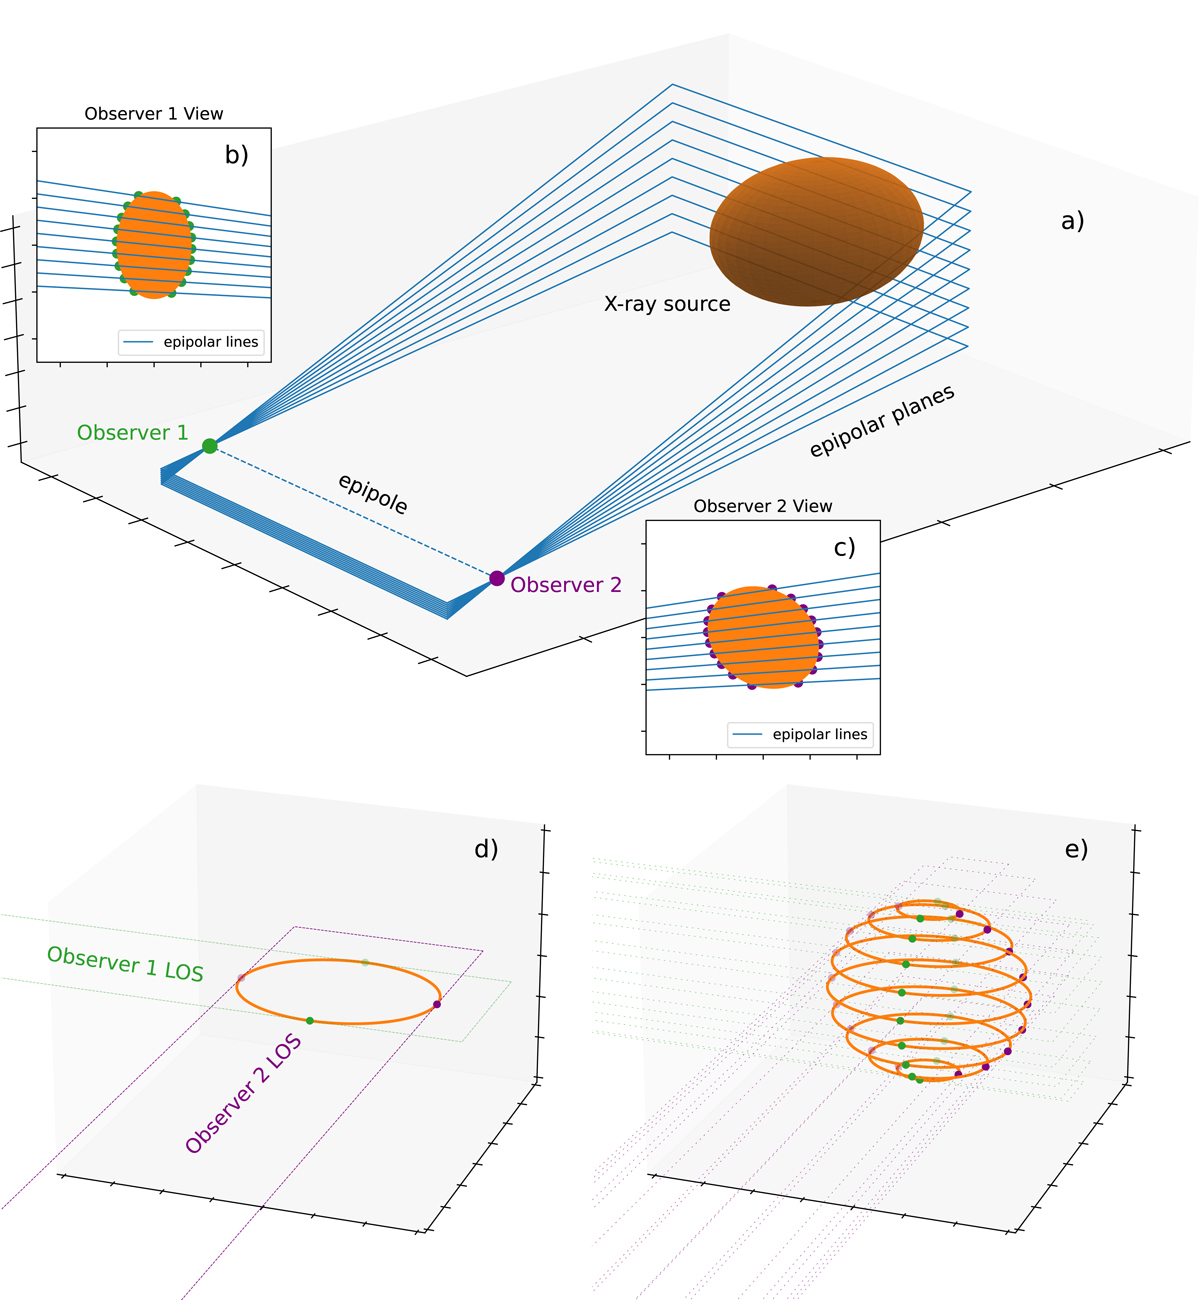
3D reconstruction via elliptical tie-pointing, adapted from Fig. 2 of Inhester (2006) and Byrne et al. (2010). a) Epipolar planes (blue rectangles) cutting through an X-ray source (elliptical orange spheroid) at progressively steepening angles. By definition, all planes pass through the epipole (dashed line) joining observers 1 (green circle) and 2 (purple circle). b) and c) 2D images of the X-ray source (orange ellipse) as seen by observers 1 and 2, respectively. The different sizes and orientations of the source are due to the source asymmetry and the different viewing angles of the observers. The blue lines show the projections of the epipolar planes onto the images. They converge towards the epipole, but in the case of flare observations, they are effectively parallel because the flare sources are small relative to the source-observer distances. The green and purple points denote the intersections of the epipolar planes with the source boundary. d) Lines of sight tangent to the X-ray source as seen from observers 1 (green) and 2 (purple) in a single epipolar plane. The lines of sight are defined by the intersections of the plane and the source boundary in the images (green and purple points in panels b and c). They form a quadrilateral within which an ellipse is inscribed to represent a cross section of the source. e) Same as panel d, repeated for multiple epipolar planes. By stacking the cross sections (orange ellipses), the X-ray source can be reconstructed in 3D.
Current usage metrics show cumulative count of Article Views (full-text article views including HTML views, PDF and ePub downloads, according to the available data) and Abstracts Views on Vision4Press platform.
Data correspond to usage on the plateform after 2015. The current usage metrics is available 48-96 hours after online publication and is updated daily on week days.
Initial download of the metrics may take a while.


