Fig. B.5.

Download original image
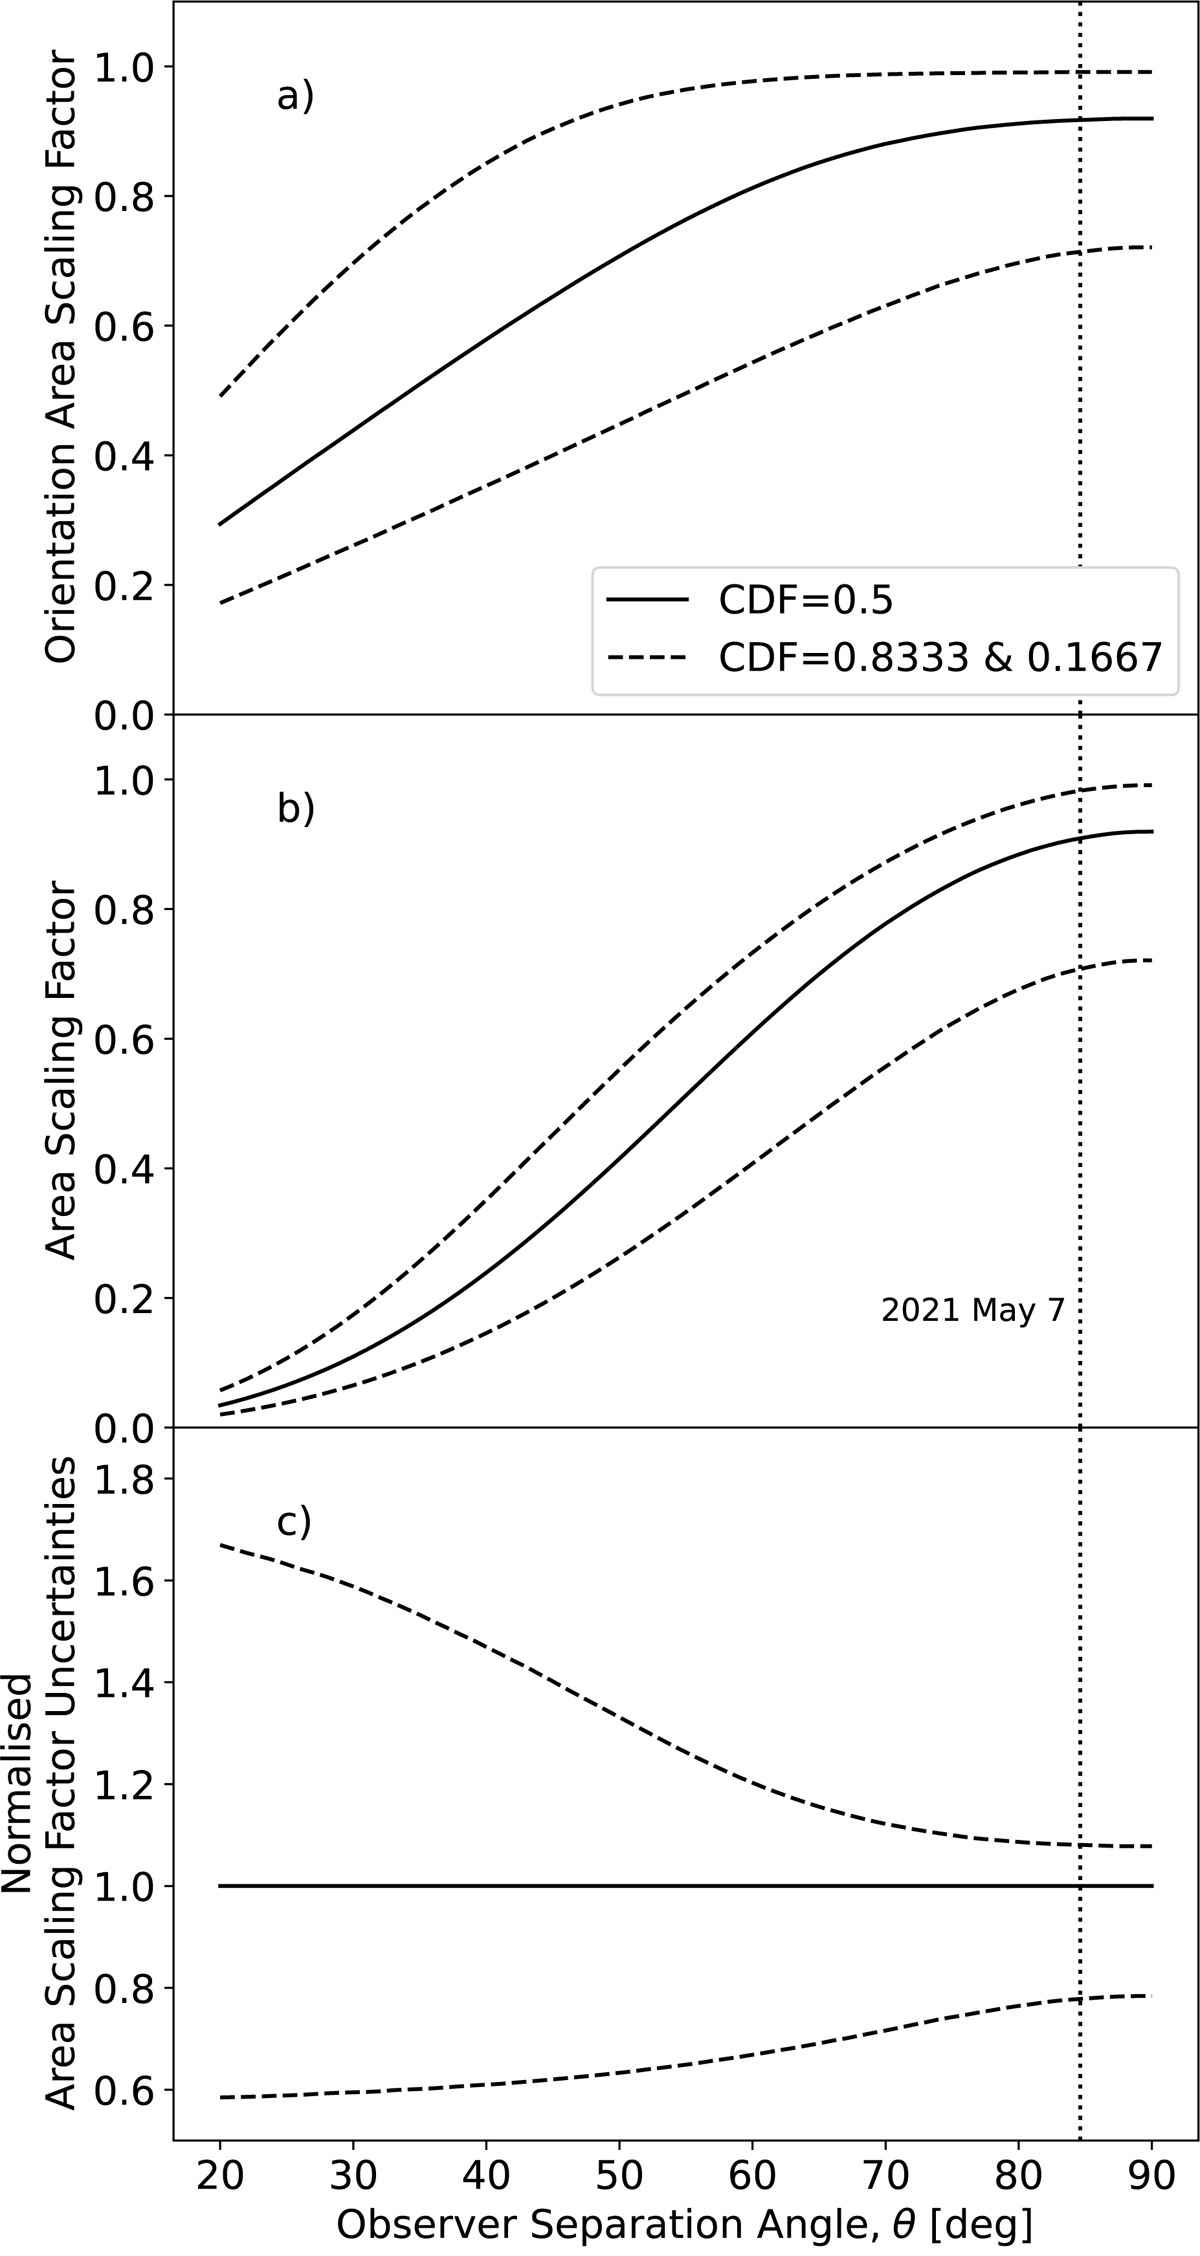
a) Orientation area scaling factor, κθϕρ, as a function of observer separation angle, θ, taken from its CDF (Figure B.4). The solid line is the relation at CDF = 0.5. This level is equally likely to be greater or lower than the true scaling factor, i.e. the one that recovers the true source area or volume. The dashed lines correspond to CDF = 0.1667, 0.8333 and represent the central range that is twice as likely to include the true scaling factor. b) Area scaling factor, κ. Equivalent to panel a, multiplied by sin2θ. c) Fractional uncertainty range of the area scaling factor (dashed lines). The vertical dotted line represents the observer separation angle from the X-ray source of the SOL2021-05-07T18:43 M3.9 flare (95.4°), equivalent to 84.6° due to symmetry about 90°.
Current usage metrics show cumulative count of Article Views (full-text article views including HTML views, PDF and ePub downloads, according to the available data) and Abstracts Views on Vision4Press platform.
Data correspond to usage on the plateform after 2015. The current usage metrics is available 48-96 hours after online publication and is updated daily on week days.
Initial download of the metrics may take a while.


