Fig. B.4.

Download original image
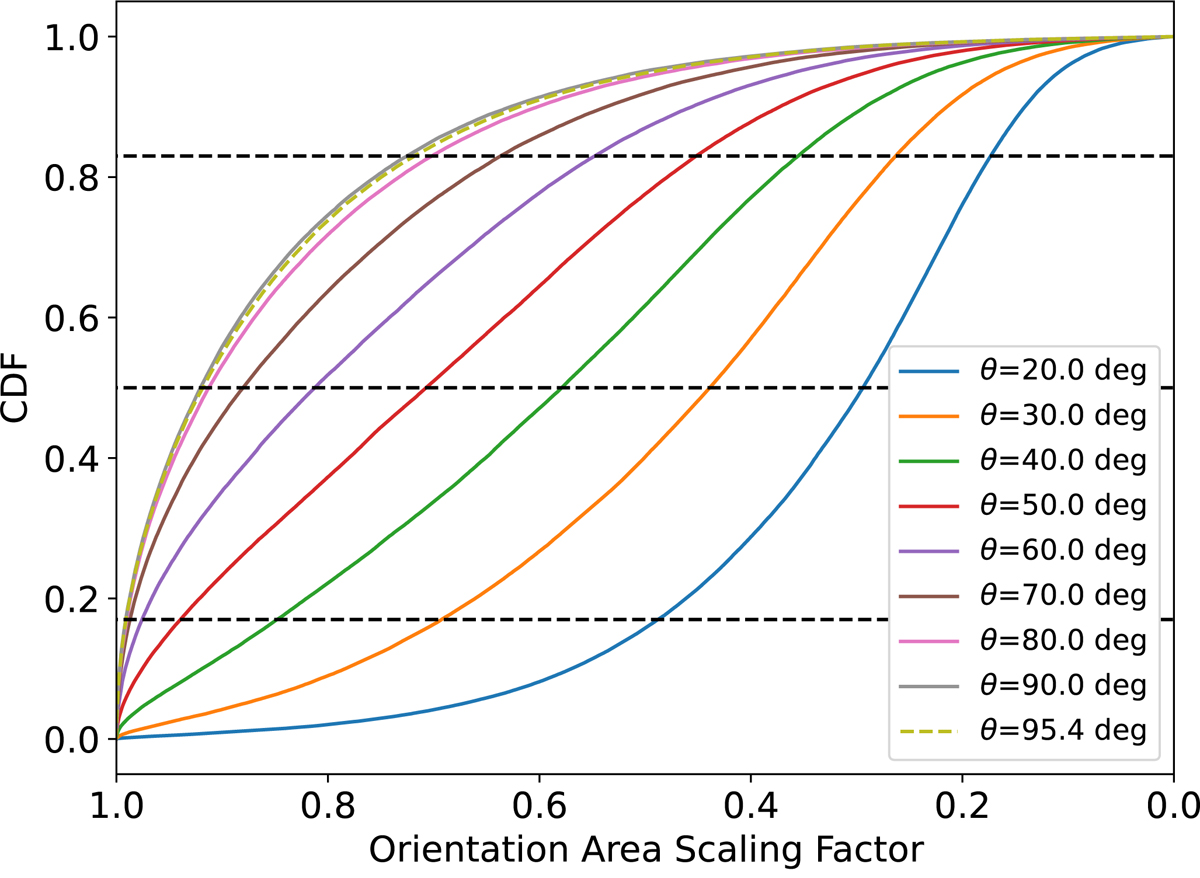
CDF of the orientation area scaling factor (Equation B.5) assuming that the source orientation, ϕ, is drawn from uniform distributions in the range 0 ° ≤ ϕ < 180° and the semi-axis ratios, ρ, from the Gaussian distribution in Figure B.3c. The CDF is shown for several values of observer separation angle, θ. The horizontal dashed lines trace the area scaling factor values at CDF = 0.1667, 0.5, 0.8333. The area scaling factor that recovers the true source area is twice as likely to lie within the upper and lower dashed lines as outside them. The dashed green-yellow line at θ = 95.4° represents the relation for the STIX-XRT-source separation angle for the SOL2021-05-07T18:43 M3.9 flare.
Current usage metrics show cumulative count of Article Views (full-text article views including HTML views, PDF and ePub downloads, according to the available data) and Abstracts Views on Vision4Press platform.
Data correspond to usage on the plateform after 2015. The current usage metrics is available 48-96 hours after online publication and is updated daily on week days.
Initial download of the metrics may take a while.


