Fig. 9
Download original image
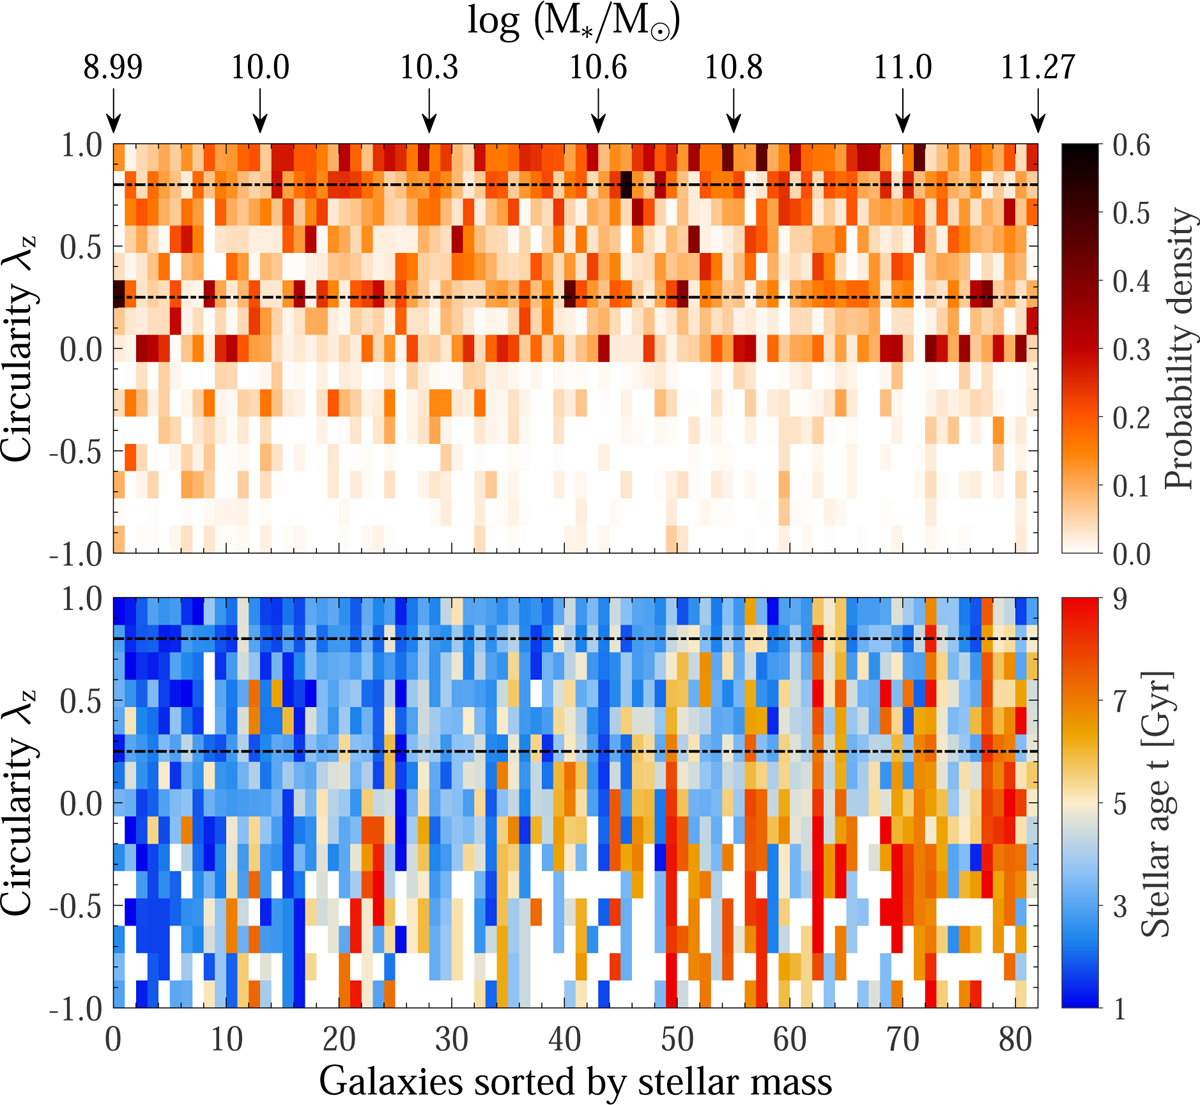
Probability density distributions of stellar orbits and the distributions of stellar ages within Re vs. circularity λz for each of the 82 CALIFA spirals. Each column in the top panel shows the orbit probability P(λz) of a certain circularity bin (y-axis) for a galaxy (x-axis), as indicated by the colour bar. The sequence of galaxies along the x-axis is sorted by increasing stellar mass from left to right, with the positions of some typical stellar mass log(M*/ M⊙) shown at the top of the figure. For each galaxy, the average circularity of all stellar orbits is calculated, with the black folded line denoting its variation with stellar mass. The results in the top panel originally come from Fig. 2 of Zhu et al. (2018b), which plots a similar orbit distribution for each of 300 CALIFA galaxies. The bottom panel correspondingly presents the age t of each circularity bin for each galaxy, with bluer pixels indicating younger stellar populations and redder pixels denoting older populations. The horizontal dashed lines in the top and middle panels divide the cold (λz ≥ 0.8), warm (0.25 < λz < 0.8), and hot (λz < 0.25, including the counter-rotating orbits) components.
Current usage metrics show cumulative count of Article Views (full-text article views including HTML views, PDF and ePub downloads, according to the available data) and Abstracts Views on Vision4Press platform.
Data correspond to usage on the plateform after 2015. The current usage metrics is available 48-96 hours after online publication and is updated daily on week days.
Initial download of the metrics may take a while.