Fig. 6
Download original image
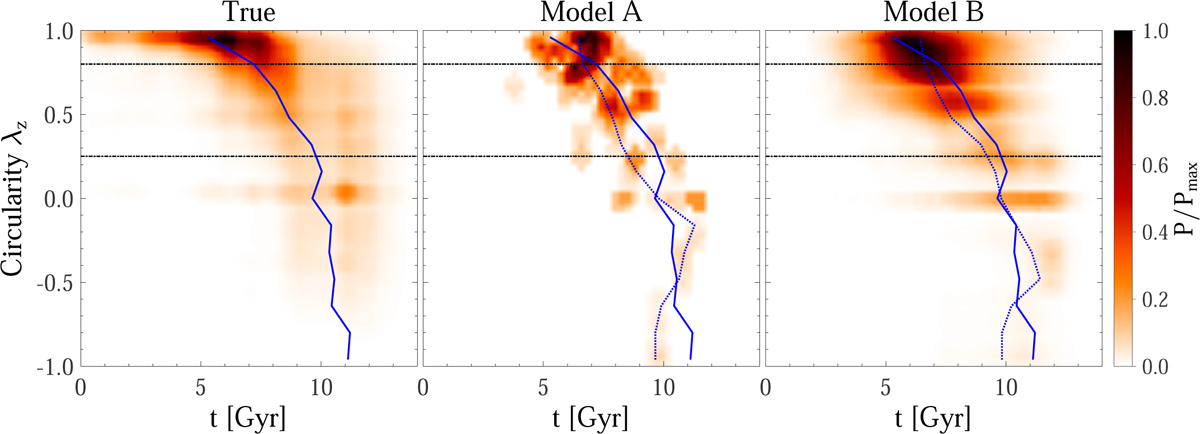
Probability density distributions of stellar orbits P(λZ, t) in the phase space of circularity λz vs. age t for Au-6-60-5. Left panel: true distribution directly derived from the simulation. Middle panel: model-recovered distribution from model A. Right panel: model-recovered distribution from model B, which is the average of all acceptable models within the 1σ confidence level. The normalised probability P/Pmax is indicated by the colour bar. The horizontal dashed lines divide the cold (λz ≥ 0.8), warm (0.25 < λz < 0.8) and hot (λz ≤ 0.25, including the counter-rotating orbits) components. The solid blue line in each panel represents the mean stellar age as a function of circularity from the simulations, while the dashed blue lines denote the model-recovered ages from models A and B.
Current usage metrics show cumulative count of Article Views (full-text article views including HTML views, PDF and ePub downloads, according to the available data) and Abstracts Views on Vision4Press platform.
Data correspond to usage on the plateform after 2015. The current usage metrics is available 48-96 hours after online publication and is updated daily on week days.
Initial download of the metrics may take a while.