Fig. 5
Download original image
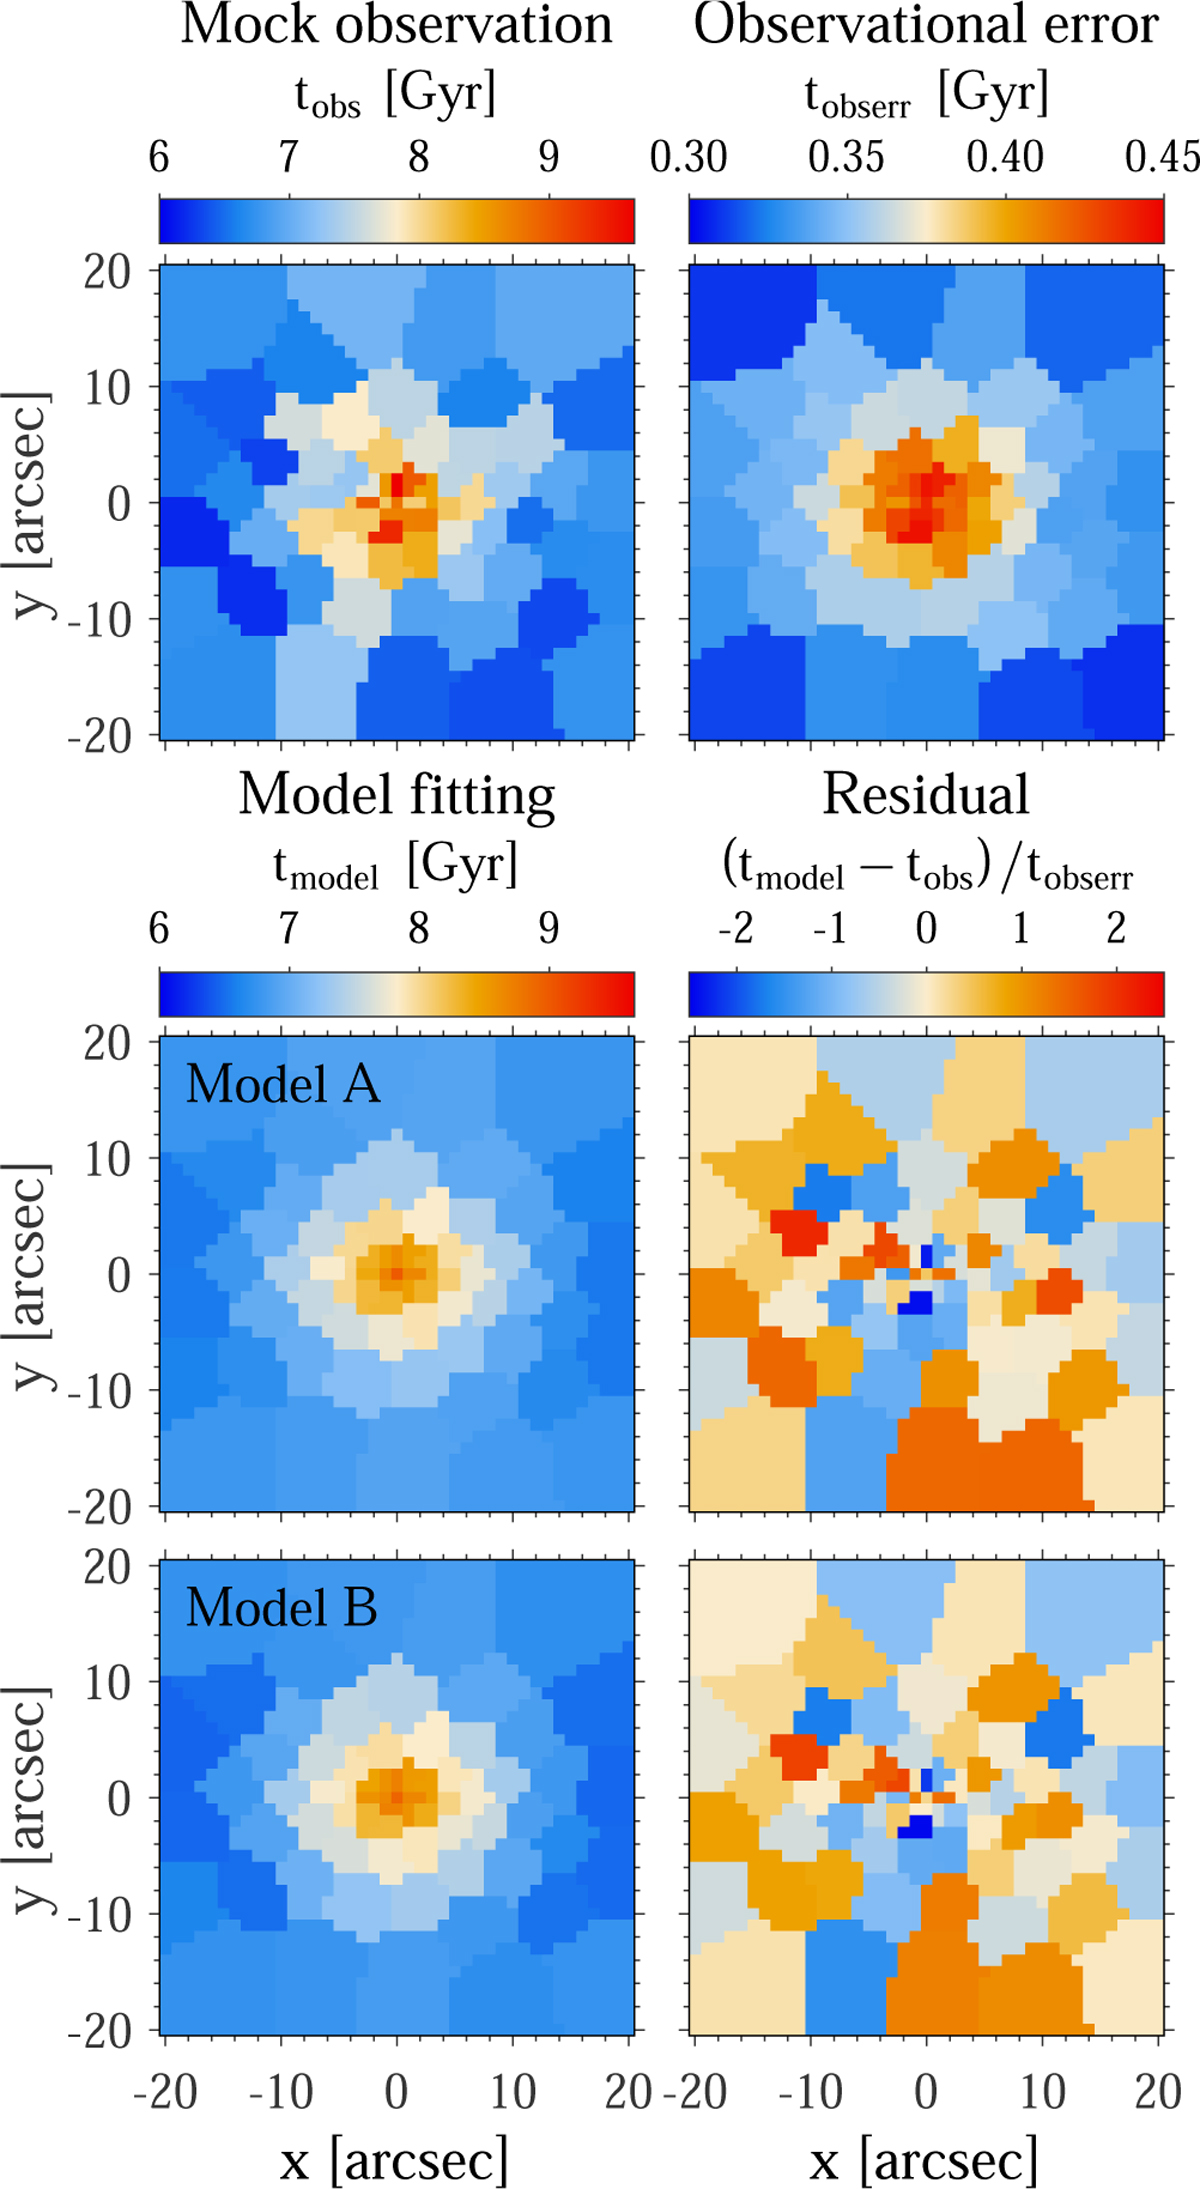
Mock age map and best-fitting models for Au-6-60-5. Top panels: mock age map tobs and mock error map tobserr. Middle panels: best-fitting age map tmodel and standardised residuals between mock observations and model fittings tstdres = (tmodel − tobs)/tobserr derived from model A. Bottom: similar to the middle panels, but derived from model B.
Current usage metrics show cumulative count of Article Views (full-text article views including HTML views, PDF and ePub downloads, according to the available data) and Abstracts Views on Vision4Press platform.
Data correspond to usage on the plateform after 2015. The current usage metrics is available 48-96 hours after online publication and is updated daily on week days.
Initial download of the metrics may take a while.