Fig. 3
Download original image
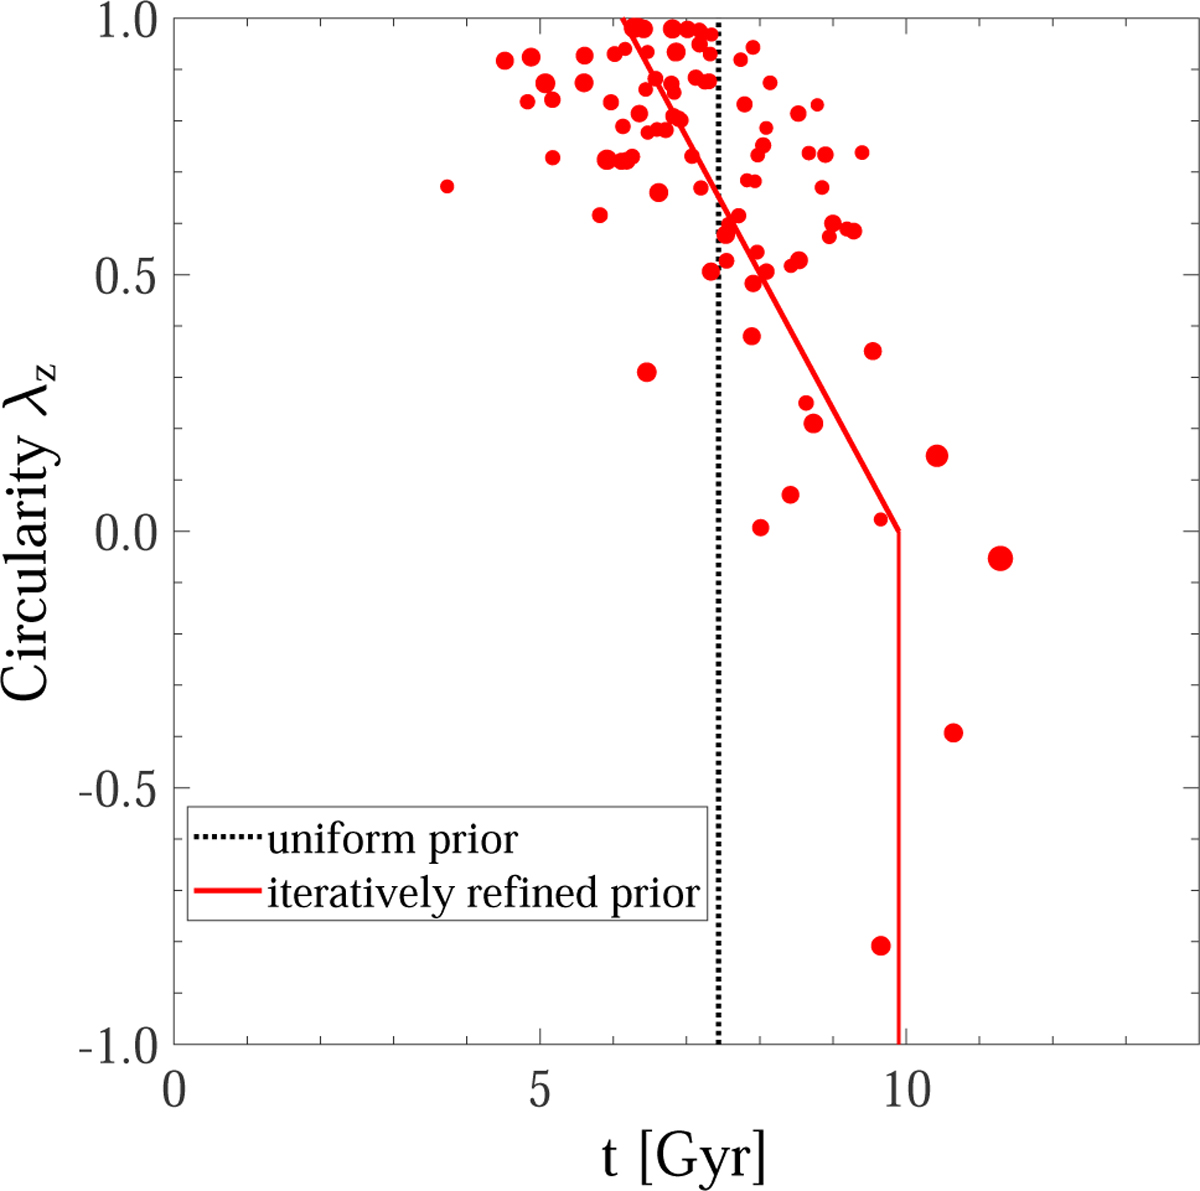
Correlation between stellar age t and circularity λz demonstrated with Au-6-60-5. The dotted black line represents µk of the uniform prior we started with, while the solid red line represents µk of the iteratively refined prior based on the results from the previous model run. The red dots represent the final tk obtained in the last model iteration. Larger dot sizes indicate larger orbit weights of the orbit bundles.
Current usage metrics show cumulative count of Article Views (full-text article views including HTML views, PDF and ePub downloads, according to the available data) and Abstracts Views on Vision4Press platform.
Data correspond to usage on the plateform after 2015. The current usage metrics is available 48-96 hours after online publication and is updated daily on week days.
Initial download of the metrics may take a while.