Fig. B.2
Download original image
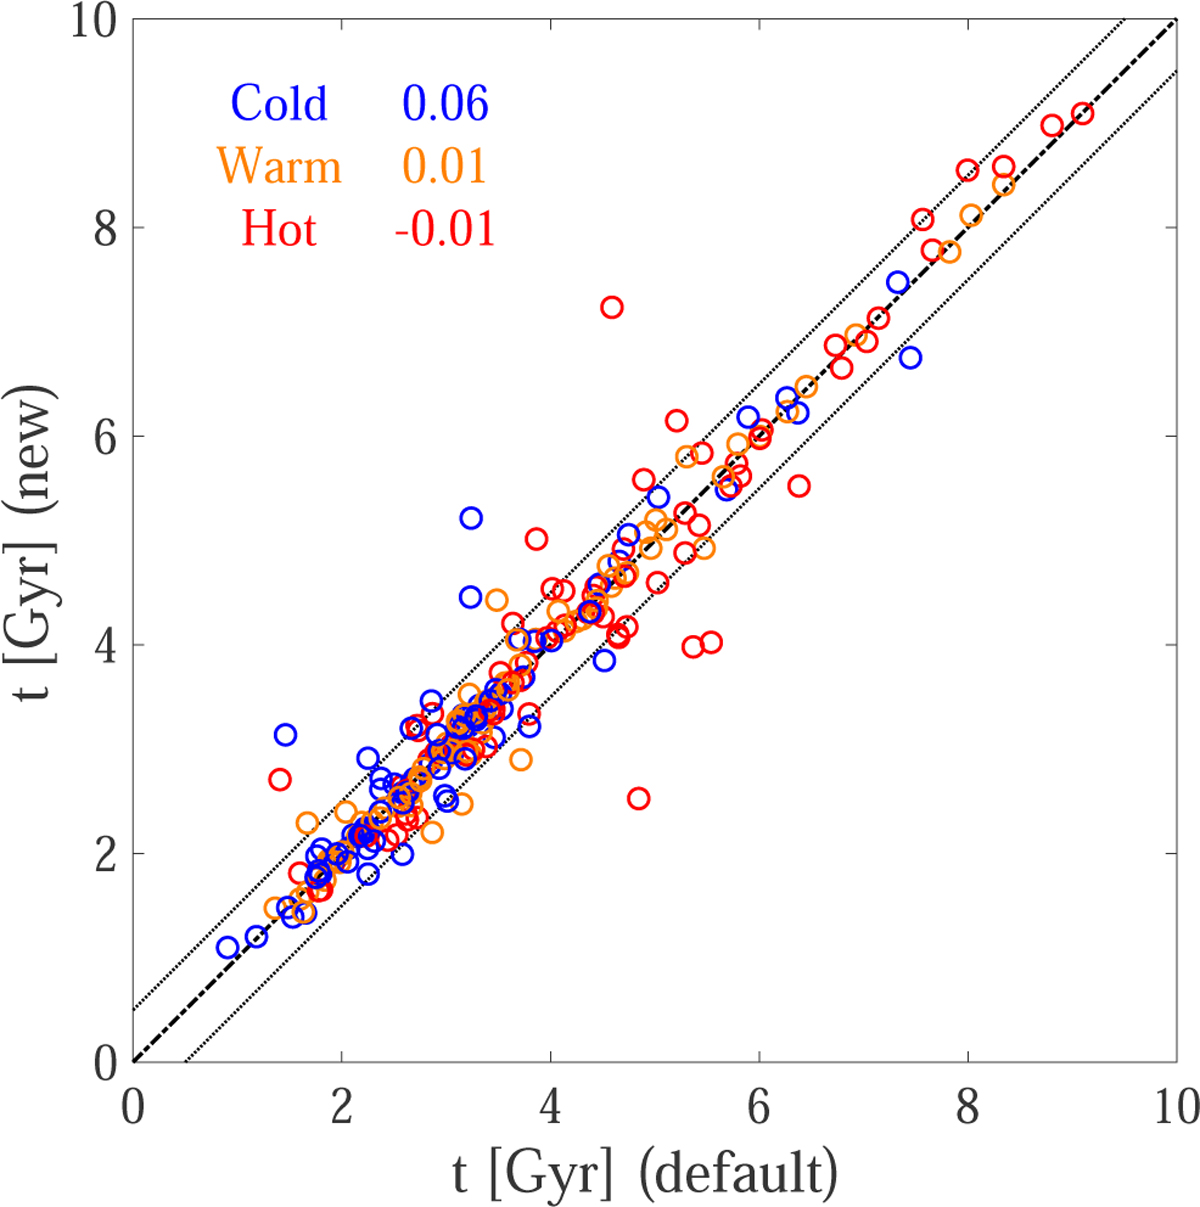
One-to-one comparison of the stellar ages of the cold, warm, and hot components derived from model B under different age error maps for 82 CALIFA spirals. The x-axis represents ages calculated under the default error maps, as defined in Equation (13), while y-axis represents ages calculated under the new error maps, as defined in Equation (B.1). The blue, orange, and red circles denote cold, warm, and hot components respectively, and the corresponding colour texts show the mean difference of the ages of different components. The dashed line represent the equality of ages, while the dotted lines are ±0.5 Gyr away from the dashed line.
Current usage metrics show cumulative count of Article Views (full-text article views including HTML views, PDF and ePub downloads, according to the available data) and Abstracts Views on Vision4Press platform.
Data correspond to usage on the plateform after 2015. The current usage metrics is available 48-96 hours after online publication and is updated daily on week days.
Initial download of the metrics may take a while.