Fig. A.2
Download original image
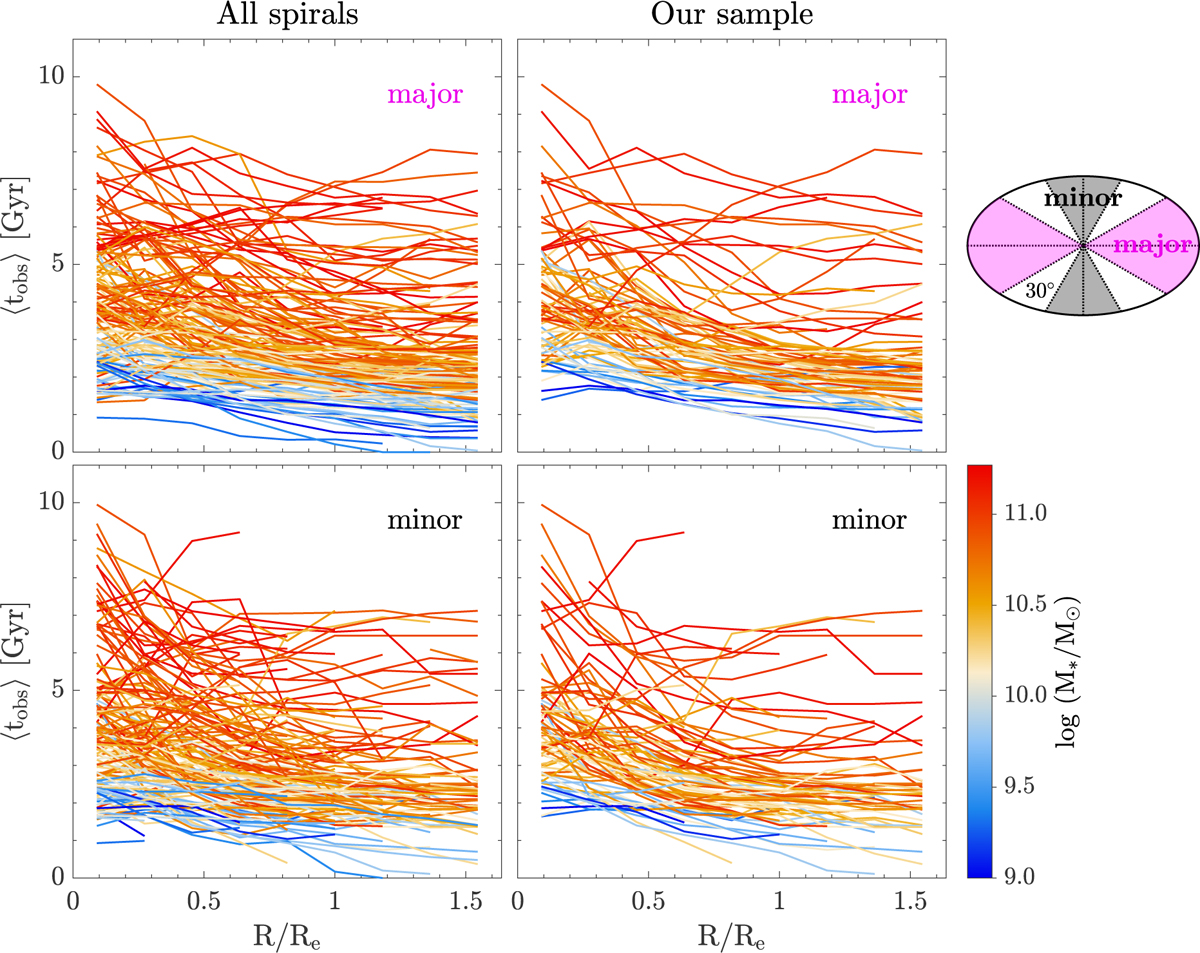
Luminosity-weighted age profiles 〈tobs〉 along the major and minor axes vs radius R/Re. The left panels show the profiles of all 160 spiral galaxies by matching the catalogues from Zhu et al. (2018b) and Zibetti et al. (2017), while the right panels show the profiles of 82 spirals in our final sample. The ellipse on the right of the figure illustrates how we calculate the age profile: for each galaxy, we find its major axis from the image and divide the image into different regions (separated by the dotted lines) by a step of 30° starting from the major axis. Then we calculate the luminosity-weighted age profile within ±30° regions away from the major axis (magenta shadow, corresponding to the top panels) and the minor axis (grey shadow, corresponding to the bottom panels). Each fold line in the panels indicates a galaxy, with its stellar mass log(M*/ M⊙) indicated by the colour bar.
Current usage metrics show cumulative count of Article Views (full-text article views including HTML views, PDF and ePub downloads, according to the available data) and Abstracts Views on Vision4Press platform.
Data correspond to usage on the plateform after 2015. The current usage metrics is available 48-96 hours after online publication and is updated daily on week days.
Initial download of the metrics may take a while.