Fig. A.1
Download original image
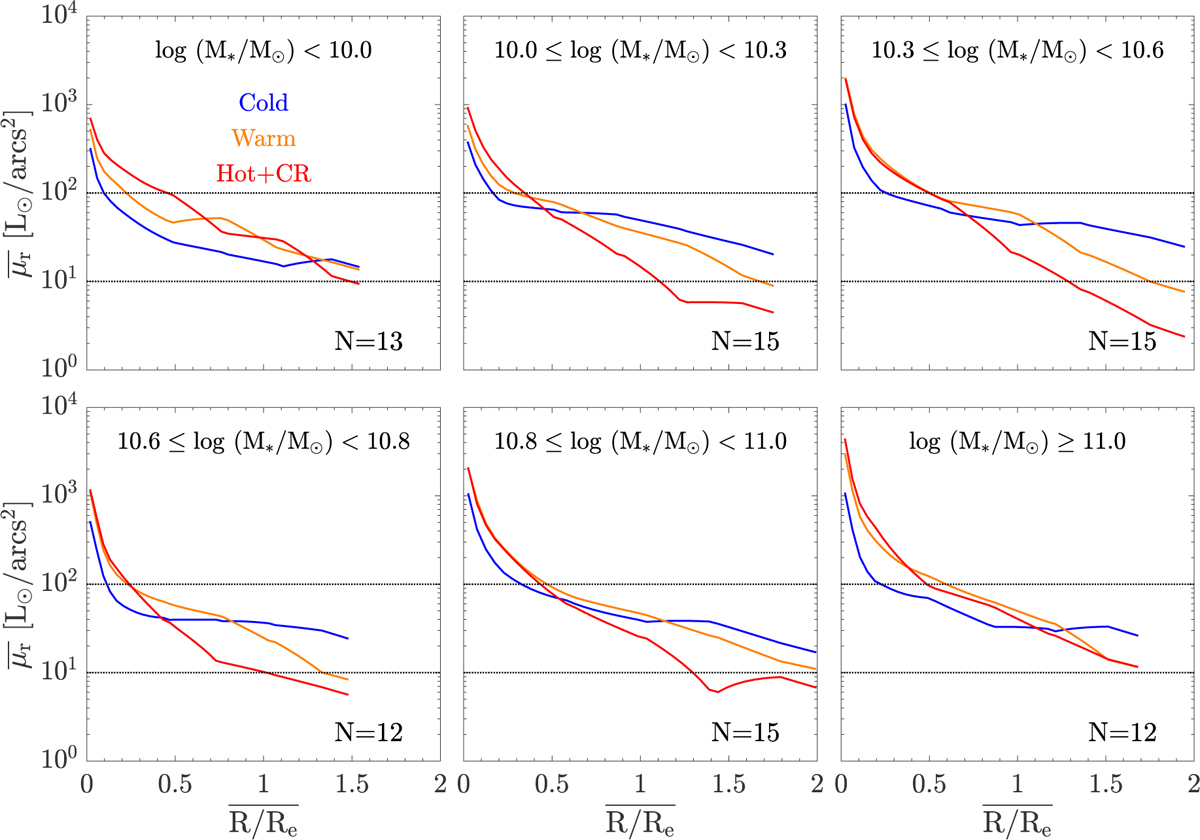
Binned r-band surface brightness profiles ![]() vs radius
vs radius ![]() . Our sample is divided into six mass bins with intervals defined by log(M*/ M⊙) = 8.9,10.0, 10.3, 10.6, 10.8,11.0, and 11.3. In each panel, we bin the profiles of galaxies within a certain mass bin for cold (λz ≥ 0.8, blue lines), warm (0.25 < λz < 0.8, orange lines), and hot (λz ≤ 0.25, red lines) components separately. The number of galaxies N in each bin is shown by the text. The horizontal dotted lines in each panel represent the values of 101 and 102.
. Our sample is divided into six mass bins with intervals defined by log(M*/ M⊙) = 8.9,10.0, 10.3, 10.6, 10.8,11.0, and 11.3. In each panel, we bin the profiles of galaxies within a certain mass bin for cold (λz ≥ 0.8, blue lines), warm (0.25 < λz < 0.8, orange lines), and hot (λz ≤ 0.25, red lines) components separately. The number of galaxies N in each bin is shown by the text. The horizontal dotted lines in each panel represent the values of 101 and 102.
Current usage metrics show cumulative count of Article Views (full-text article views including HTML views, PDF and ePub downloads, according to the available data) and Abstracts Views on Vision4Press platform.
Data correspond to usage on the plateform after 2015. The current usage metrics is available 48-96 hours after online publication and is updated daily on week days.
Initial download of the metrics may take a while.