Fig. 13
Download original image
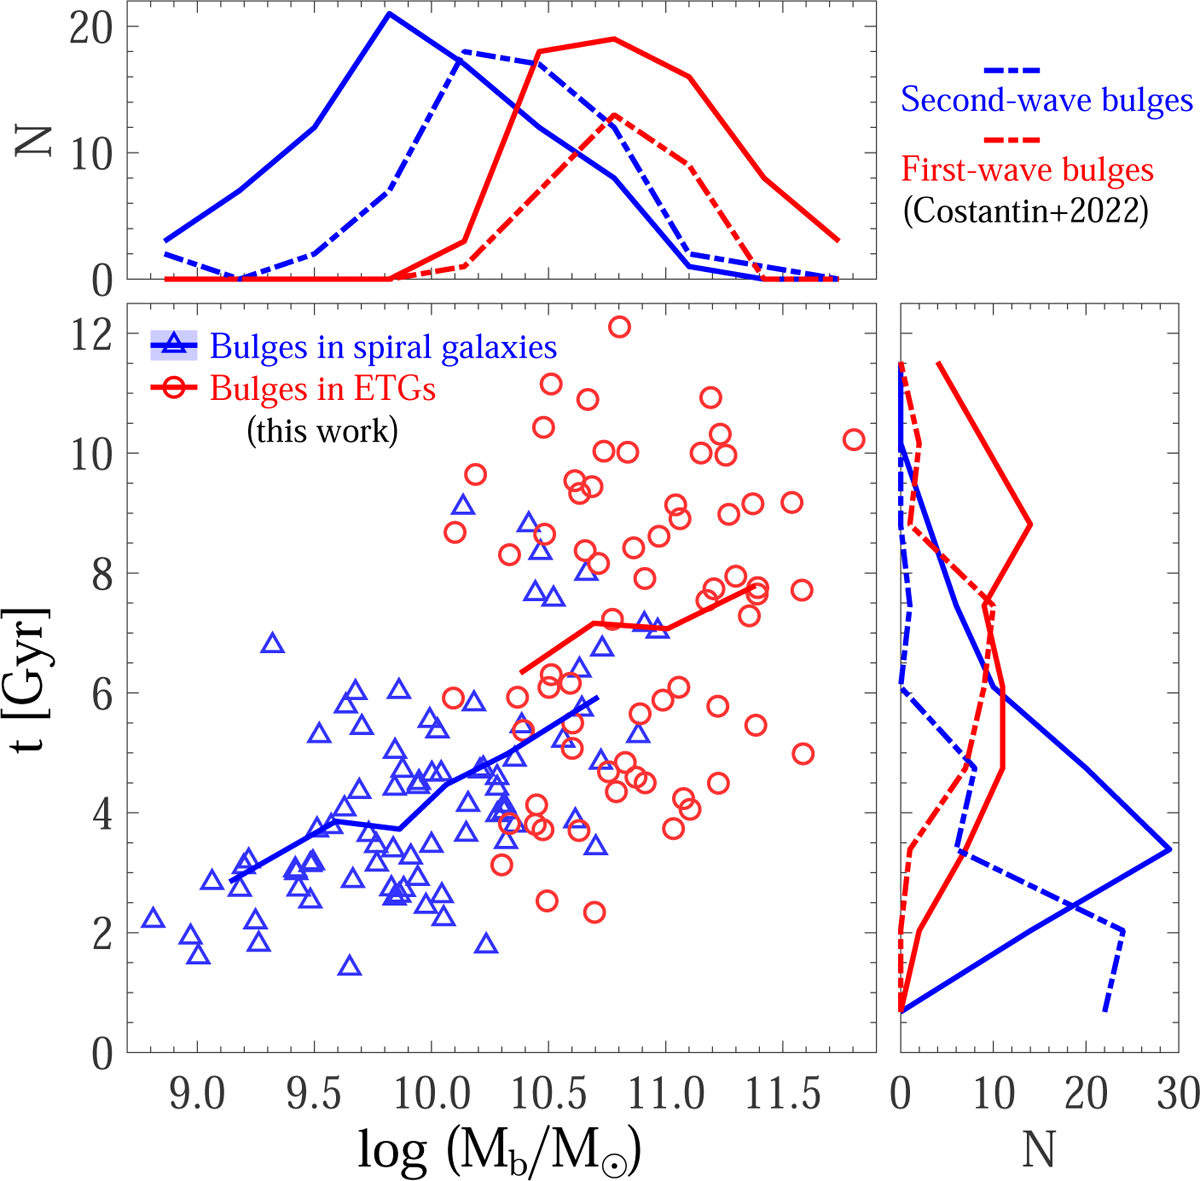
Bulge ages vs. bulge mass for spiral galaxies and early-type galaxies. In the main panel, the blue triangles represent 82 bulges in spiral galaxies in our sample, and their ages correspond to the ages of the hot component within Re derived from model B. The red circles denote 67 bulges in early-type galaxies in our contrast sample, and their ages correspond to the luminosity-weighted mean ages calculated from the age maps. The solid blue line with the shadow represents the mean bulge ages and uncertainties of spiral galaxies within different mass bins, and the solid red line denotes the mean bulge ages of early-type galaxies within different mass bins. In the top and right panels, the corresponding coloured solid lines represent the marginalised distributions of bulge mass and bulge ages in our work. The dashed lines denote the distributions from Costantin et al. (2022), and the blue lines represent the second-wave bulges, and the red lines represent the first-wave bulges.
Current usage metrics show cumulative count of Article Views (full-text article views including HTML views, PDF and ePub downloads, according to the available data) and Abstracts Views on Vision4Press platform.
Data correspond to usage on the plateform after 2015. The current usage metrics is available 48-96 hours after online publication and is updated daily on week days.
Initial download of the metrics may take a while.