Fig. 11
Download original image
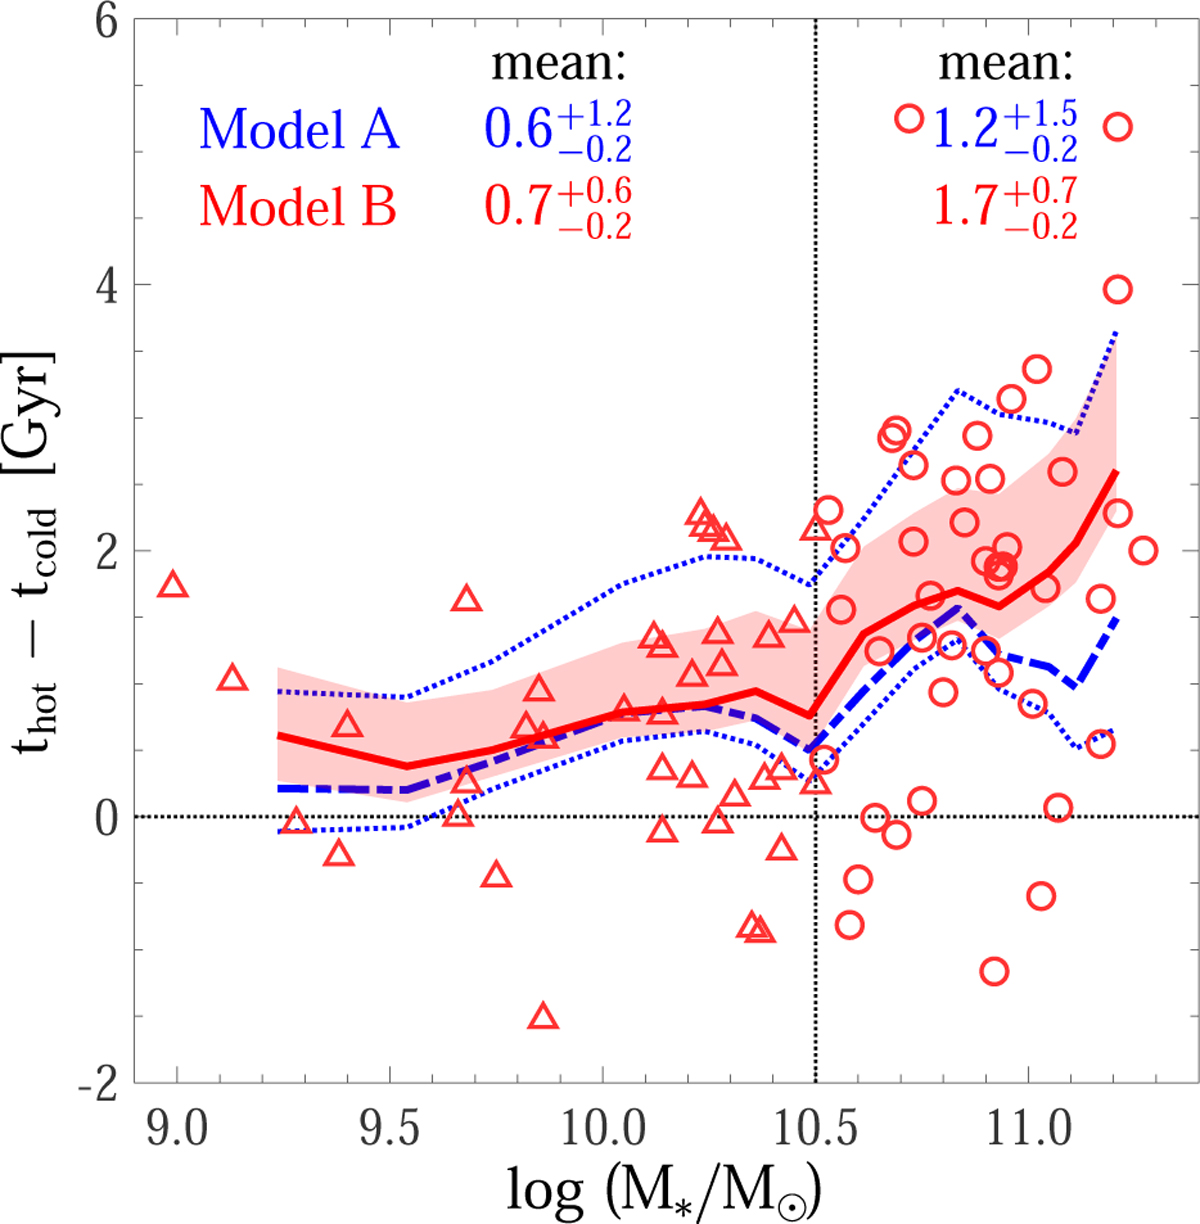
Age difference between the hot and cold orbit components thot − tcold within Re vs. stellar mass. The red markers indicate thot − tcold derived from model B for each galaxy in our sample, with the triangles representing low-mass spirals (M* ≤ 10105M⊙) and the circles representing high-mass spirals (M* > 10105M⊙). The corresponding red curve represents the moving average of thot − tcold. The red shadow denotes the overall uncertainties of model B. For comparison, the moving average of thot − tcold and the overall uncertainties derived from model A are shown by the dashed and dotted blue lines. The horizontal dotted line means thot − tcold, while the vertical dotted line denotes M* = 10105 M⊙. The mean values of thot − tcold for low-mass spirals and high-mass spirals are shown by the texts.
Current usage metrics show cumulative count of Article Views (full-text article views including HTML views, PDF and ePub downloads, according to the available data) and Abstracts Views on Vision4Press platform.
Data correspond to usage on the plateform after 2015. The current usage metrics is available 48-96 hours after online publication and is updated daily on week days.
Initial download of the metrics may take a while.