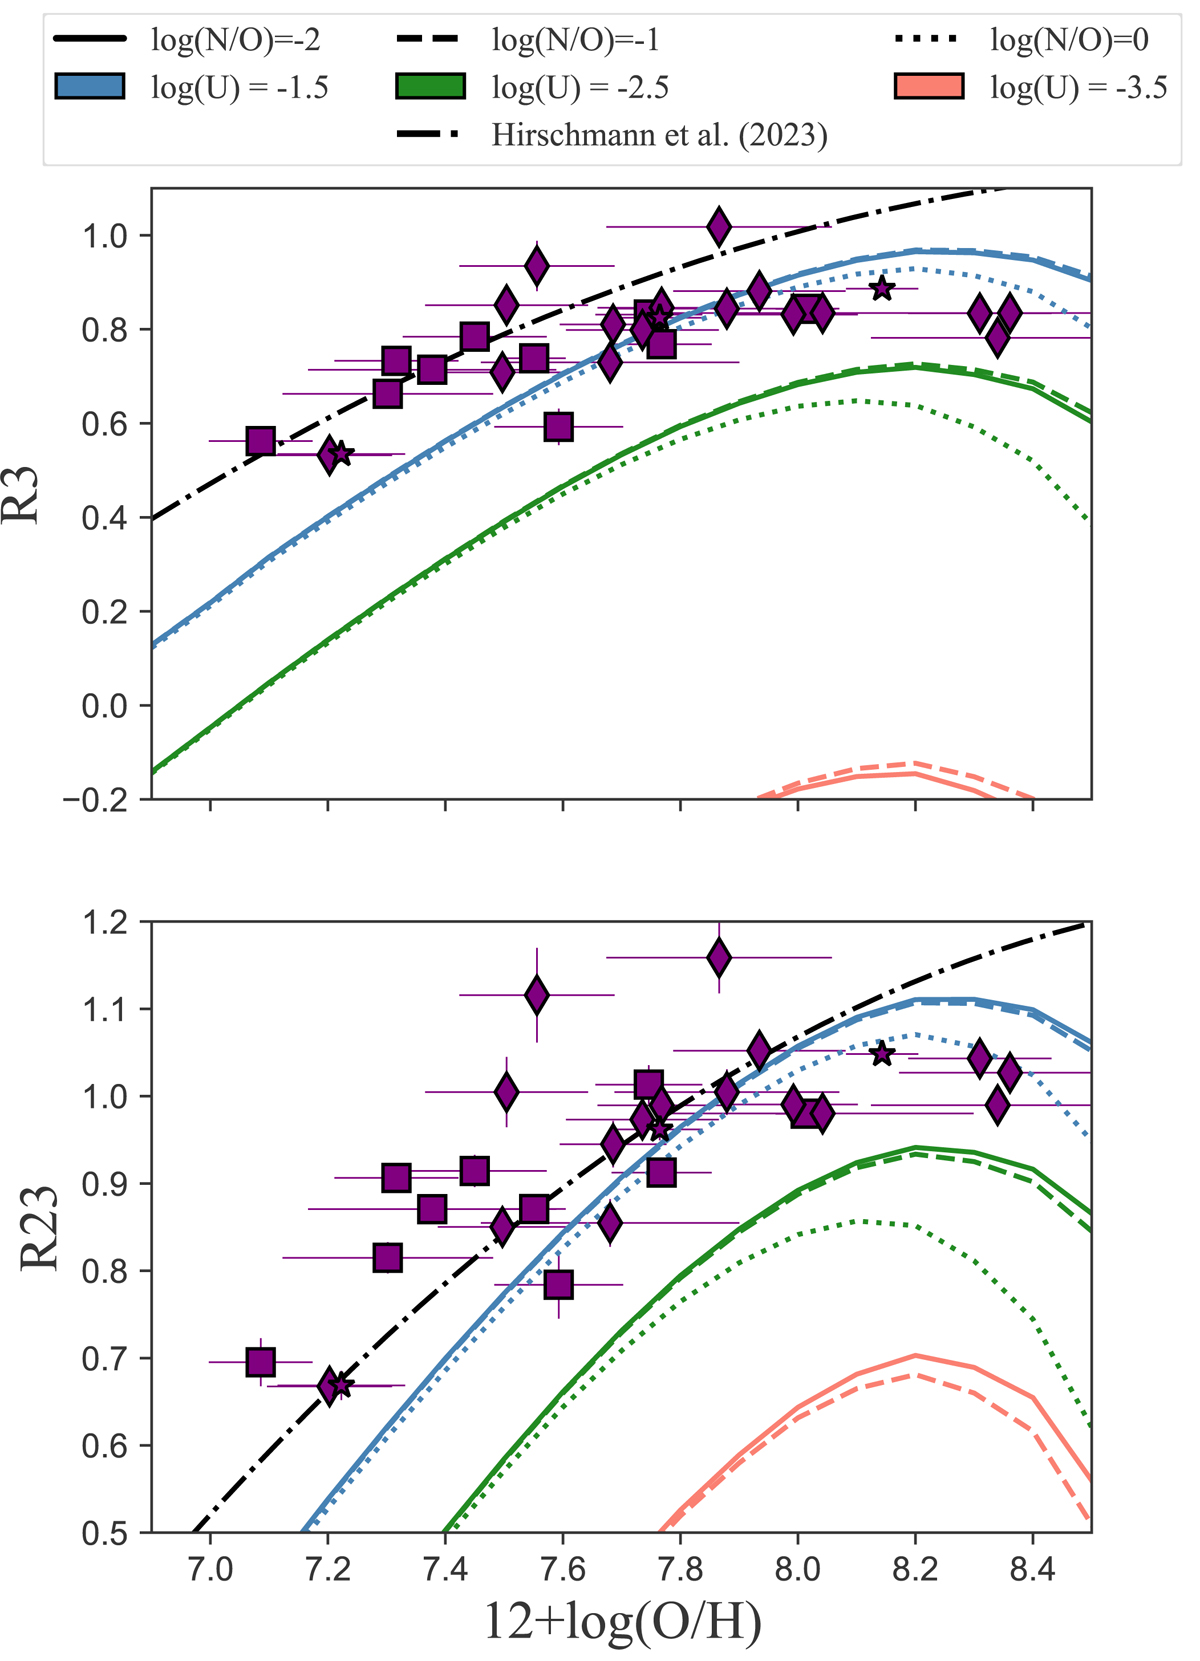
Fig. 8.
Download original image
R3 versus 12 + log(O/H) and R23 vs. 12 + log(O/H) with calibrations from Hirschmann et al. (2023; black, dot-dashed) and photoionization models from Pérez-Montero (2014). We investigate N/O values of −2.0 (purple), −1.0 (green), and 0.0 (red), and log(U) values of −1.5 (dashed), −2.5 (solid), and −3.5 (dotted). Symbols are the same as in Fig. 4.
Current usage metrics show cumulative count of Article Views (full-text article views including HTML views, PDF and ePub downloads, according to the available data) and Abstracts Views on Vision4Press platform.
Data correspond to usage on the plateform after 2015. The current usage metrics is available 48-96 hours after online publication and is updated daily on week days.
Initial download of the metrics may take a while.