Fig. B.1.
Download original image
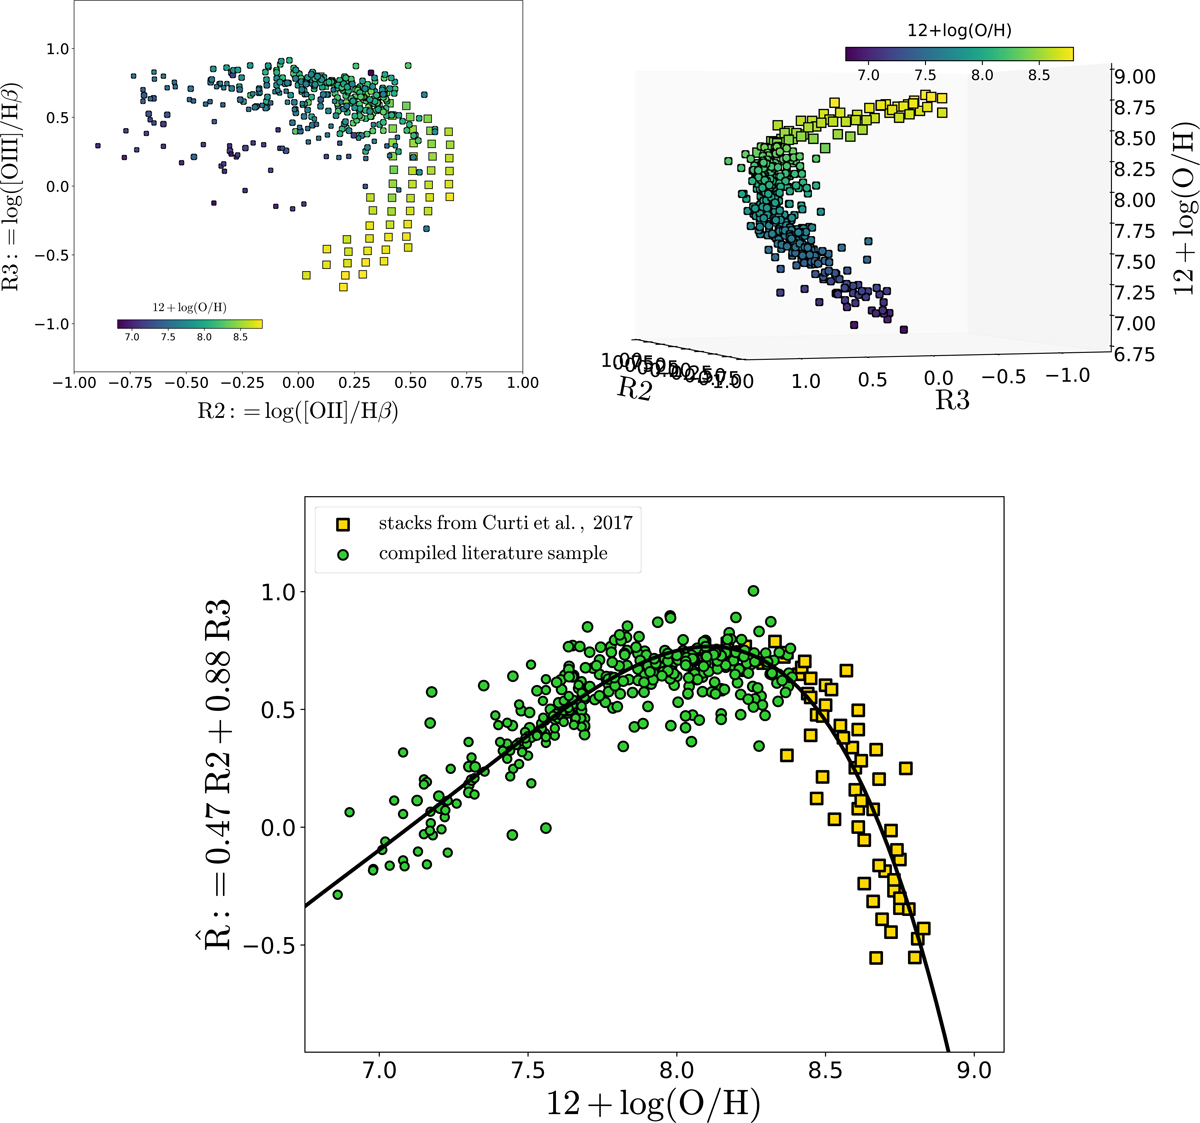
Determination of calibration. Top-left: Distribution of our combined sample of stacked spectra (solid squares, from Curti et al. 2017) and individual galaxies (solid circles, compiled from literature as described in the text of Appendix B) in the R2 vs R3 diagram. Each point is color-coded by the Te-derived metallicity. Top-right: Rotation by 61.82 degrees of the R2-R3 plane around the O/H axis. Such a projection minimizes the scatter in metallicity at fixed = 0.47 R2 + 0.88 R3. Bottom panel : Best-fit polynomial relation (black curve) defining the calibration for the diagnostic is shown together with the full calibration sample.
Current usage metrics show cumulative count of Article Views (full-text article views including HTML views, PDF and ePub downloads, according to the available data) and Abstracts Views on Vision4Press platform.
Data correspond to usage on the plateform after 2015. The current usage metrics is available 48-96 hours after online publication and is updated daily on week days.
Initial download of the metrics may take a while.