Fig. 16
Download original image
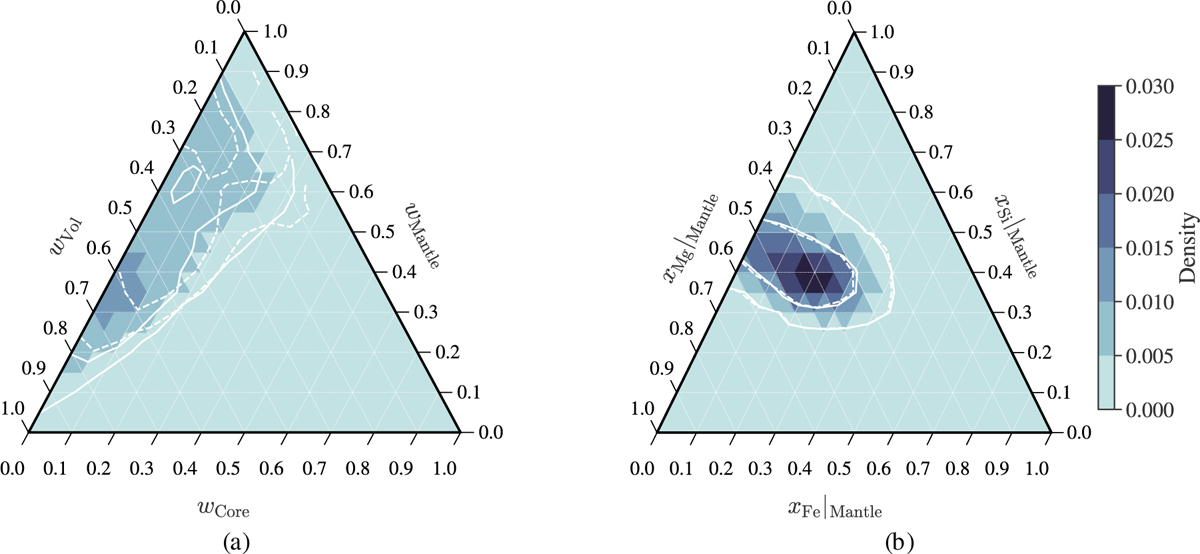
Kernel density estimates (KDE) of the posterior probability distribution of compositional parameters of TOI-130 b inferred using BICEPS. The KDEs were calculated using a Gaussian Kernel with standard deviation of 0.2. Panel a: KDE of the layer mass fractions of TOI-130 b. Panel b: KDE of the mantle composition of TOI-130 b. White solid lines: indicate the contours of the 68%-HDR and 95%-HDR. White dashed lines: indicate the 68%-HDR and 95%-HDR of the posterior distribution calculated with the original model of D17.
Current usage metrics show cumulative count of Article Views (full-text article views including HTML views, PDF and ePub downloads, according to the available data) and Abstracts Views on Vision4Press platform.
Data correspond to usage on the plateform after 2015. The current usage metrics is available 48-96 hours after online publication and is updated daily on week days.
Initial download of the metrics may take a while.