Open Access
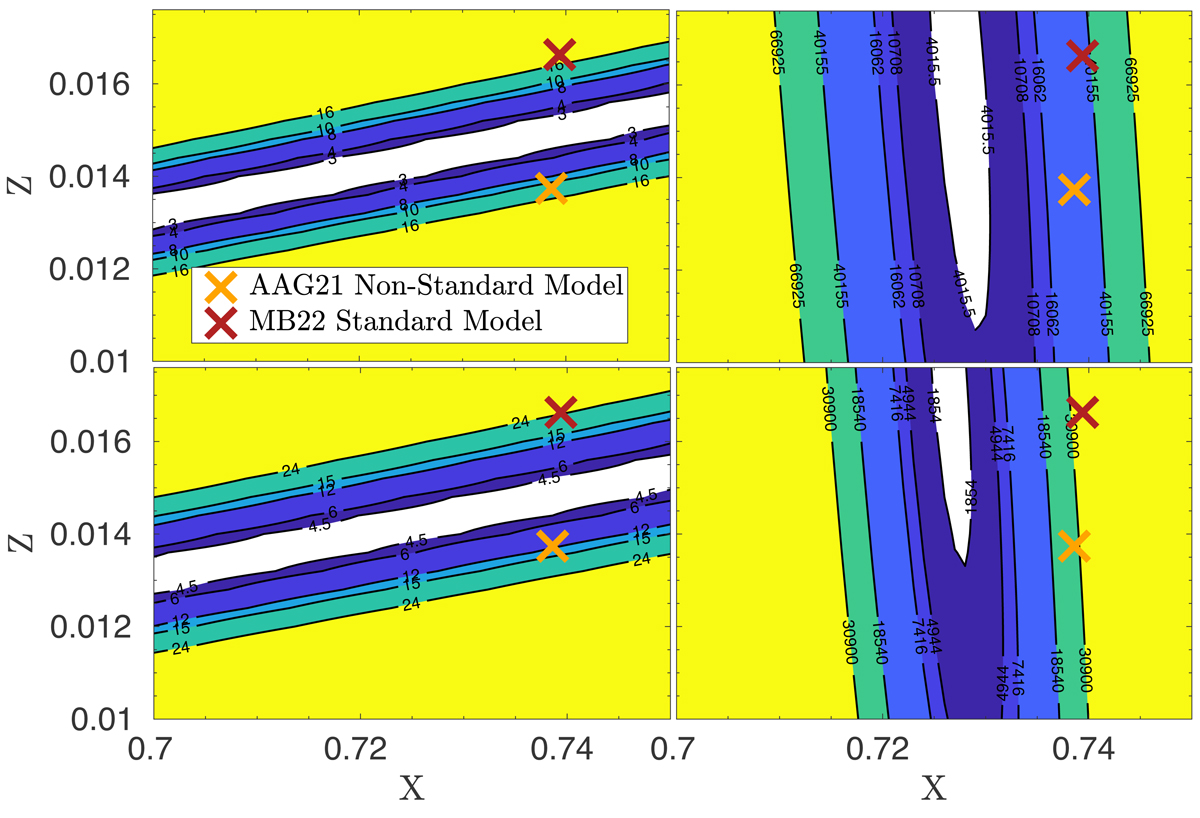
Fig. 7.
Download original image
Same as Fig. 6 for models A1 (upper panels) and M1 (lower panels), using FreeEOS in the reconstruction. The left panel is associated with the high-T subdomain for the Z determination, while the right panel is associated with the low-T subdomain used to determine X.
Current usage metrics show cumulative count of Article Views (full-text article views including HTML views, PDF and ePub downloads, according to the available data) and Abstracts Views on Vision4Press platform.
Data correspond to usage on the plateform after 2015. The current usage metrics is available 48-96 hours after online publication and is updated daily on week days.
Initial download of the metrics may take a while.