Fig. 10.
Download original image
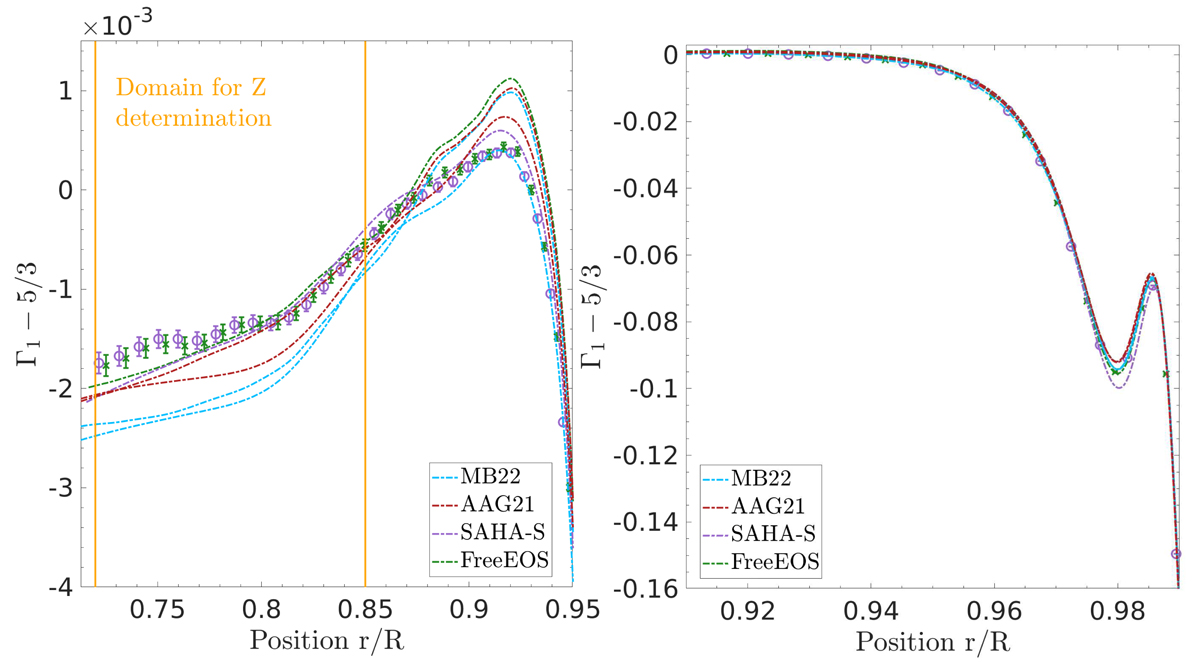
Inversions of the Γ1 profile as a function of normalised radius in the solar enveloped, determined using the Larson & Schou (2015) dataset. Left panel: subdomain of the method for the Z determination (indicated by the orange vertical lines). Right panel: subdomain of the method for the X determination. The green curve and symbols are associated with model M1 (FreeEOS), whereas the purple curve and symbols are associated with model A2 (SAHA-S v7). The red and blue lines illustrate models A1 and A2 and M1 and M2, respectively.
Current usage metrics show cumulative count of Article Views (full-text article views including HTML views, PDF and ePub downloads, according to the available data) and Abstracts Views on Vision4Press platform.
Data correspond to usage on the plateform after 2015. The current usage metrics is available 48-96 hours after online publication and is updated daily on week days.
Initial download of the metrics may take a while.