Fig. 7
Download original image
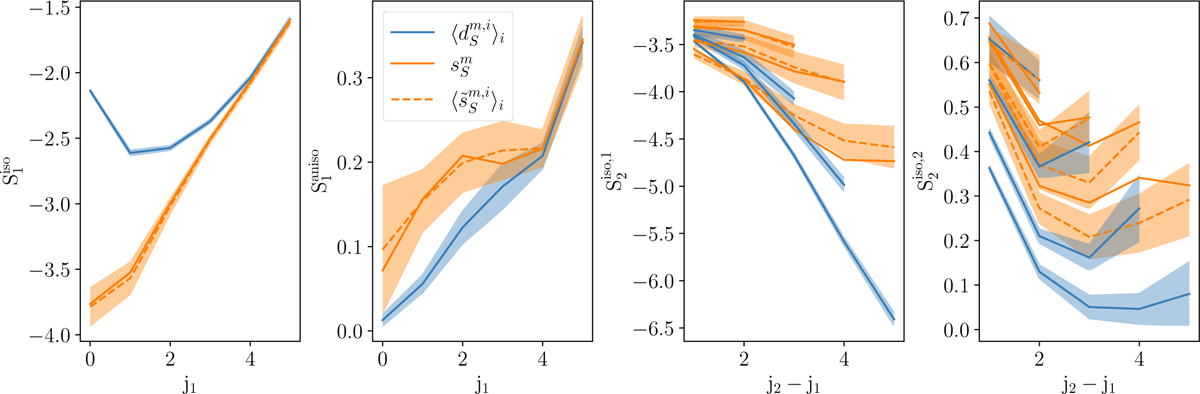
RWST statistics of the input and output maps of the component separation applied to the mock data. The RWST statistics of ![]() ,
, ![]() , and
, and ![]() are compared. From left to right, the figure panels display
are compared. From left to right, the figure panels display ![]() (power at a given dyadic scale),
(power at a given dyadic scale), ![]() (level of anisotropy at a given dyadic scale),
(level of anisotropy at a given dyadic scale), ![]() (couplings between different dyadic scales), and
(couplings between different dyadic scales), and ![]() (angular modulation of the couplings between different dyadic scales). The variable j corresponds to the physical scale of 2j. The
(angular modulation of the couplings between different dyadic scales). The variable j corresponds to the physical scale of 2j. The ![]() and
and ![]() are normalized with respect to the
are normalized with respect to the ![]() and are plotted as a function of the scale ratio j2−j1 for j1 ∈ [0, J − 1] and j2 ∈ [j1 + 1, J − 1]. Each curve corresponds to a given j1. The colored bands represent the ±1σ error-bars.
and are plotted as a function of the scale ratio j2−j1 for j1 ∈ [0, J − 1] and j2 ∈ [j1 + 1, J − 1]. Each curve corresponds to a given j1. The colored bands represent the ±1σ error-bars.
Current usage metrics show cumulative count of Article Views (full-text article views including HTML views, PDF and ePub downloads, according to the available data) and Abstracts Views on Vision4Press platform.
Data correspond to usage on the plateform after 2015. The current usage metrics is available 48-96 hours after online publication and is updated daily on week days.
Initial download of the metrics may take a while.