Fig. 11
Download original image
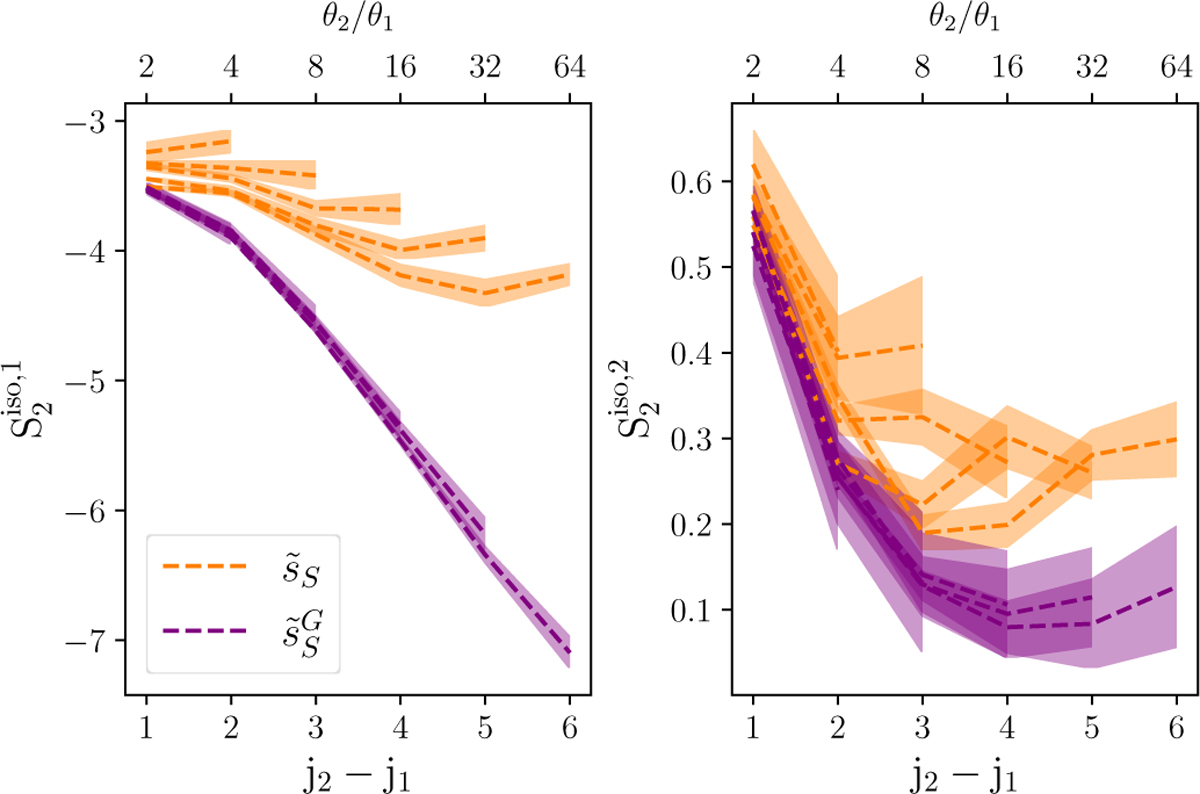
RWST statistics of the output dust map for the component separation applied to Herschel SPIRE maps at 250 μm. The ![]() (left) and
(left) and ![]() (right) coefficients of
(right) coefficients of ![]() and
and ![]() are compared. These coefficients correspond respectively to the couplings between dyadic scales and their angular modulation. They are normalized with respect to the
are compared. These coefficients correspond respectively to the couplings between dyadic scales and their angular modulation. They are normalized with respect to the ![]() and are plotted as a function of j2 − j1 for j1 ∈ [0, J − 1] and j2 ∈ [j1 + 1, J − 1]. Each curve corresponds to a given j1. The j2 − j1 differences on the bottom axes correspond to ratio of angular scales θ2/θ1 on the top axes. The colored bands represent ±1σ error-bars. These coefficients testify of the not-scale invariance and the filamentary structure of the output dust map
and are plotted as a function of j2 − j1 for j1 ∈ [0, J − 1] and j2 ∈ [j1 + 1, J − 1]. Each curve corresponds to a given j1. The j2 − j1 differences on the bottom axes correspond to ratio of angular scales θ2/θ1 on the top axes. The colored bands represent ±1σ error-bars. These coefficients testify of the not-scale invariance and the filamentary structure of the output dust map ![]() .
.
Current usage metrics show cumulative count of Article Views (full-text article views including HTML views, PDF and ePub downloads, according to the available data) and Abstracts Views on Vision4Press platform.
Data correspond to usage on the plateform after 2015. The current usage metrics is available 48-96 hours after online publication and is updated daily on week days.
Initial download of the metrics may take a while.