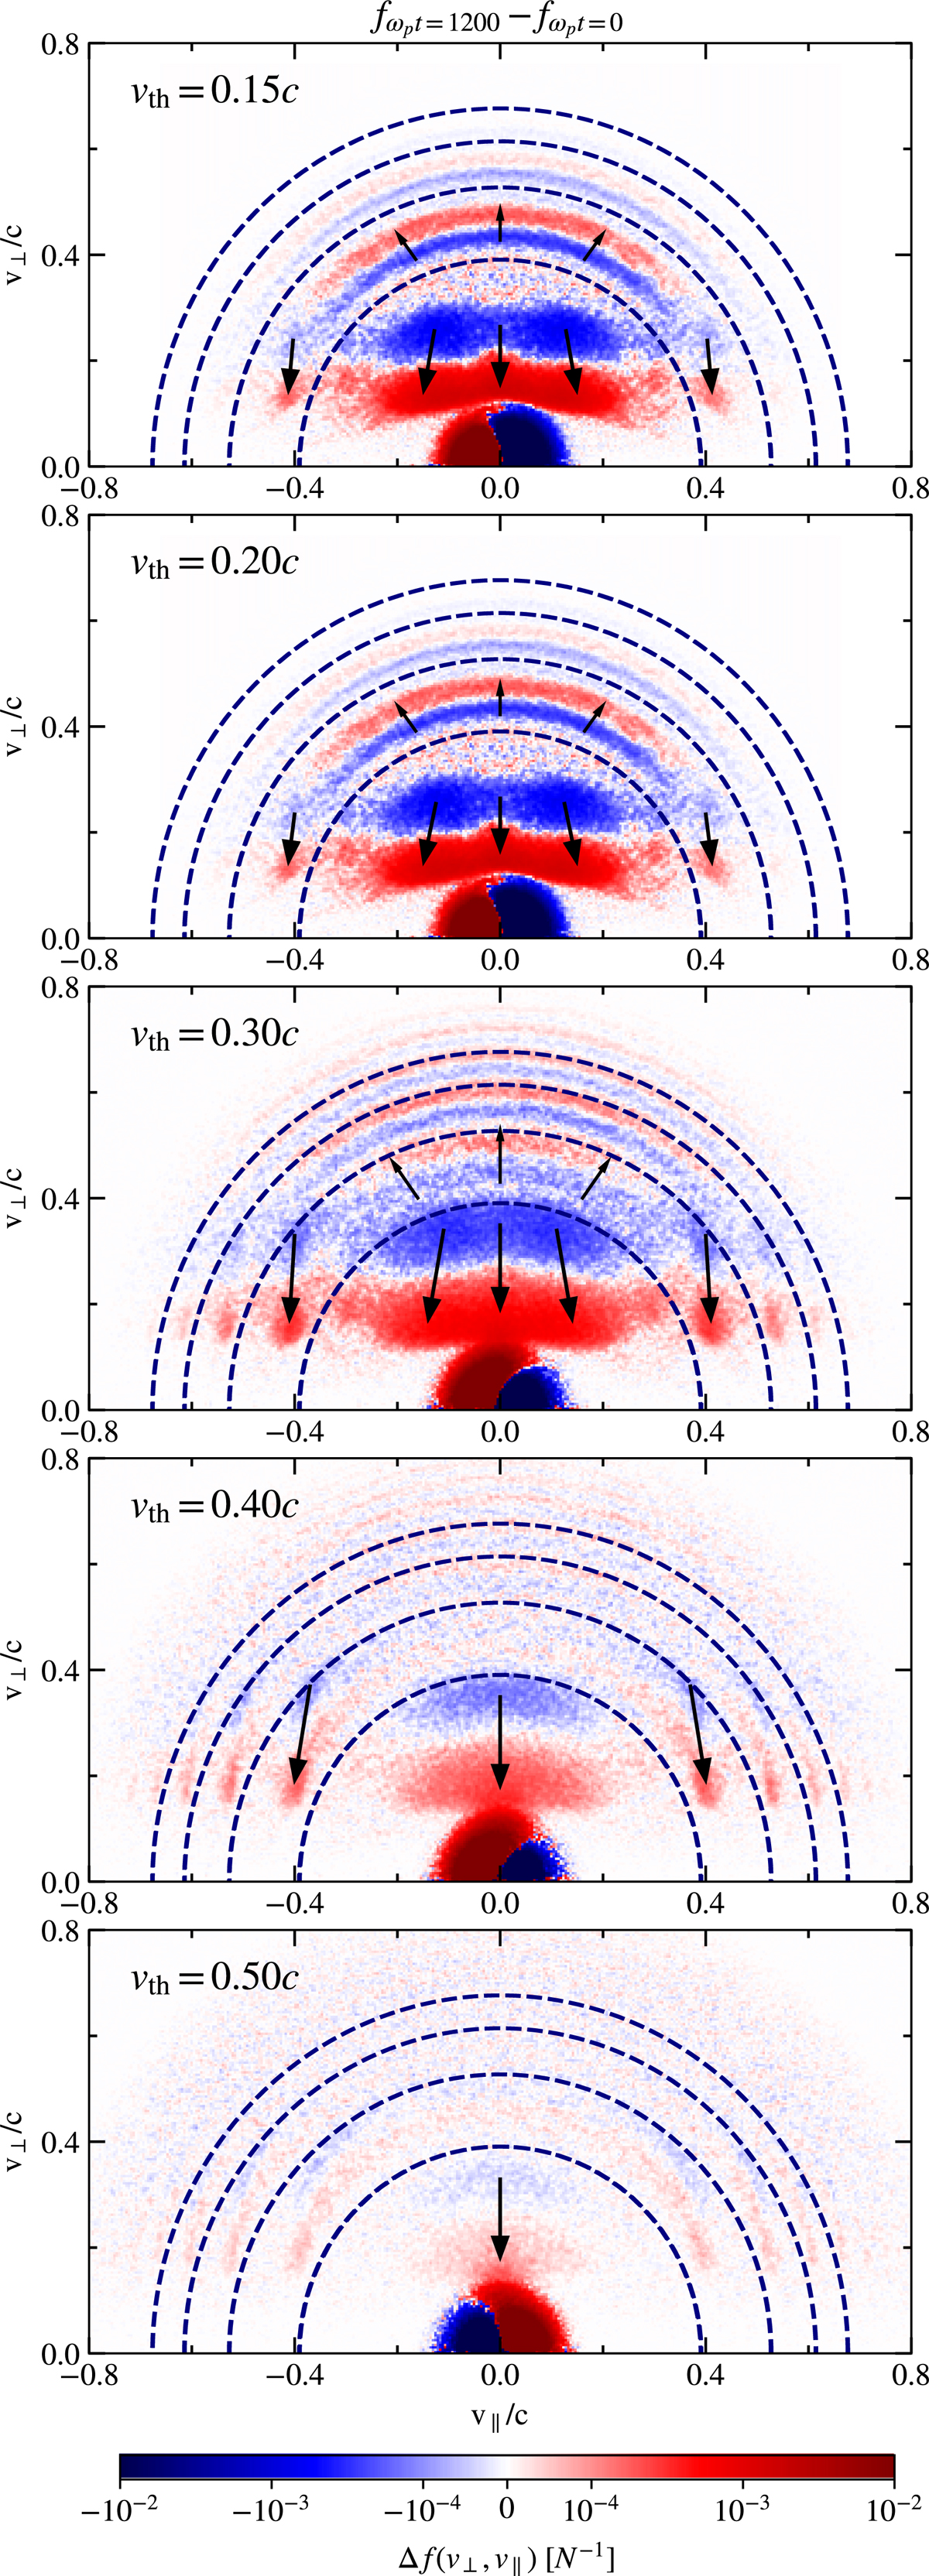
Fig. 9.
Download original image
Differences in the velocity distribution functions Δf(v⊥, v∥) between the final (ωpt = 1200) and the initial state (ωpt = 0) for an increasing value of the characteristic thermal velocity vth (rows). The dashed lines represent resonance curves for gyro-harmonic numbers s = 12, 13, 14, 15, with s = 12 being closest to zero velocity. Arrows denote shifts in the VDF contained within the resonance curves.
Current usage metrics show cumulative count of Article Views (full-text article views including HTML views, PDF and ePub downloads, according to the available data) and Abstracts Views on Vision4Press platform.
Data correspond to usage on the plateform after 2015. The current usage metrics is available 48-96 hours after online publication and is updated daily on week days.
Initial download of the metrics may take a while.