Open Access
Fig. 4.
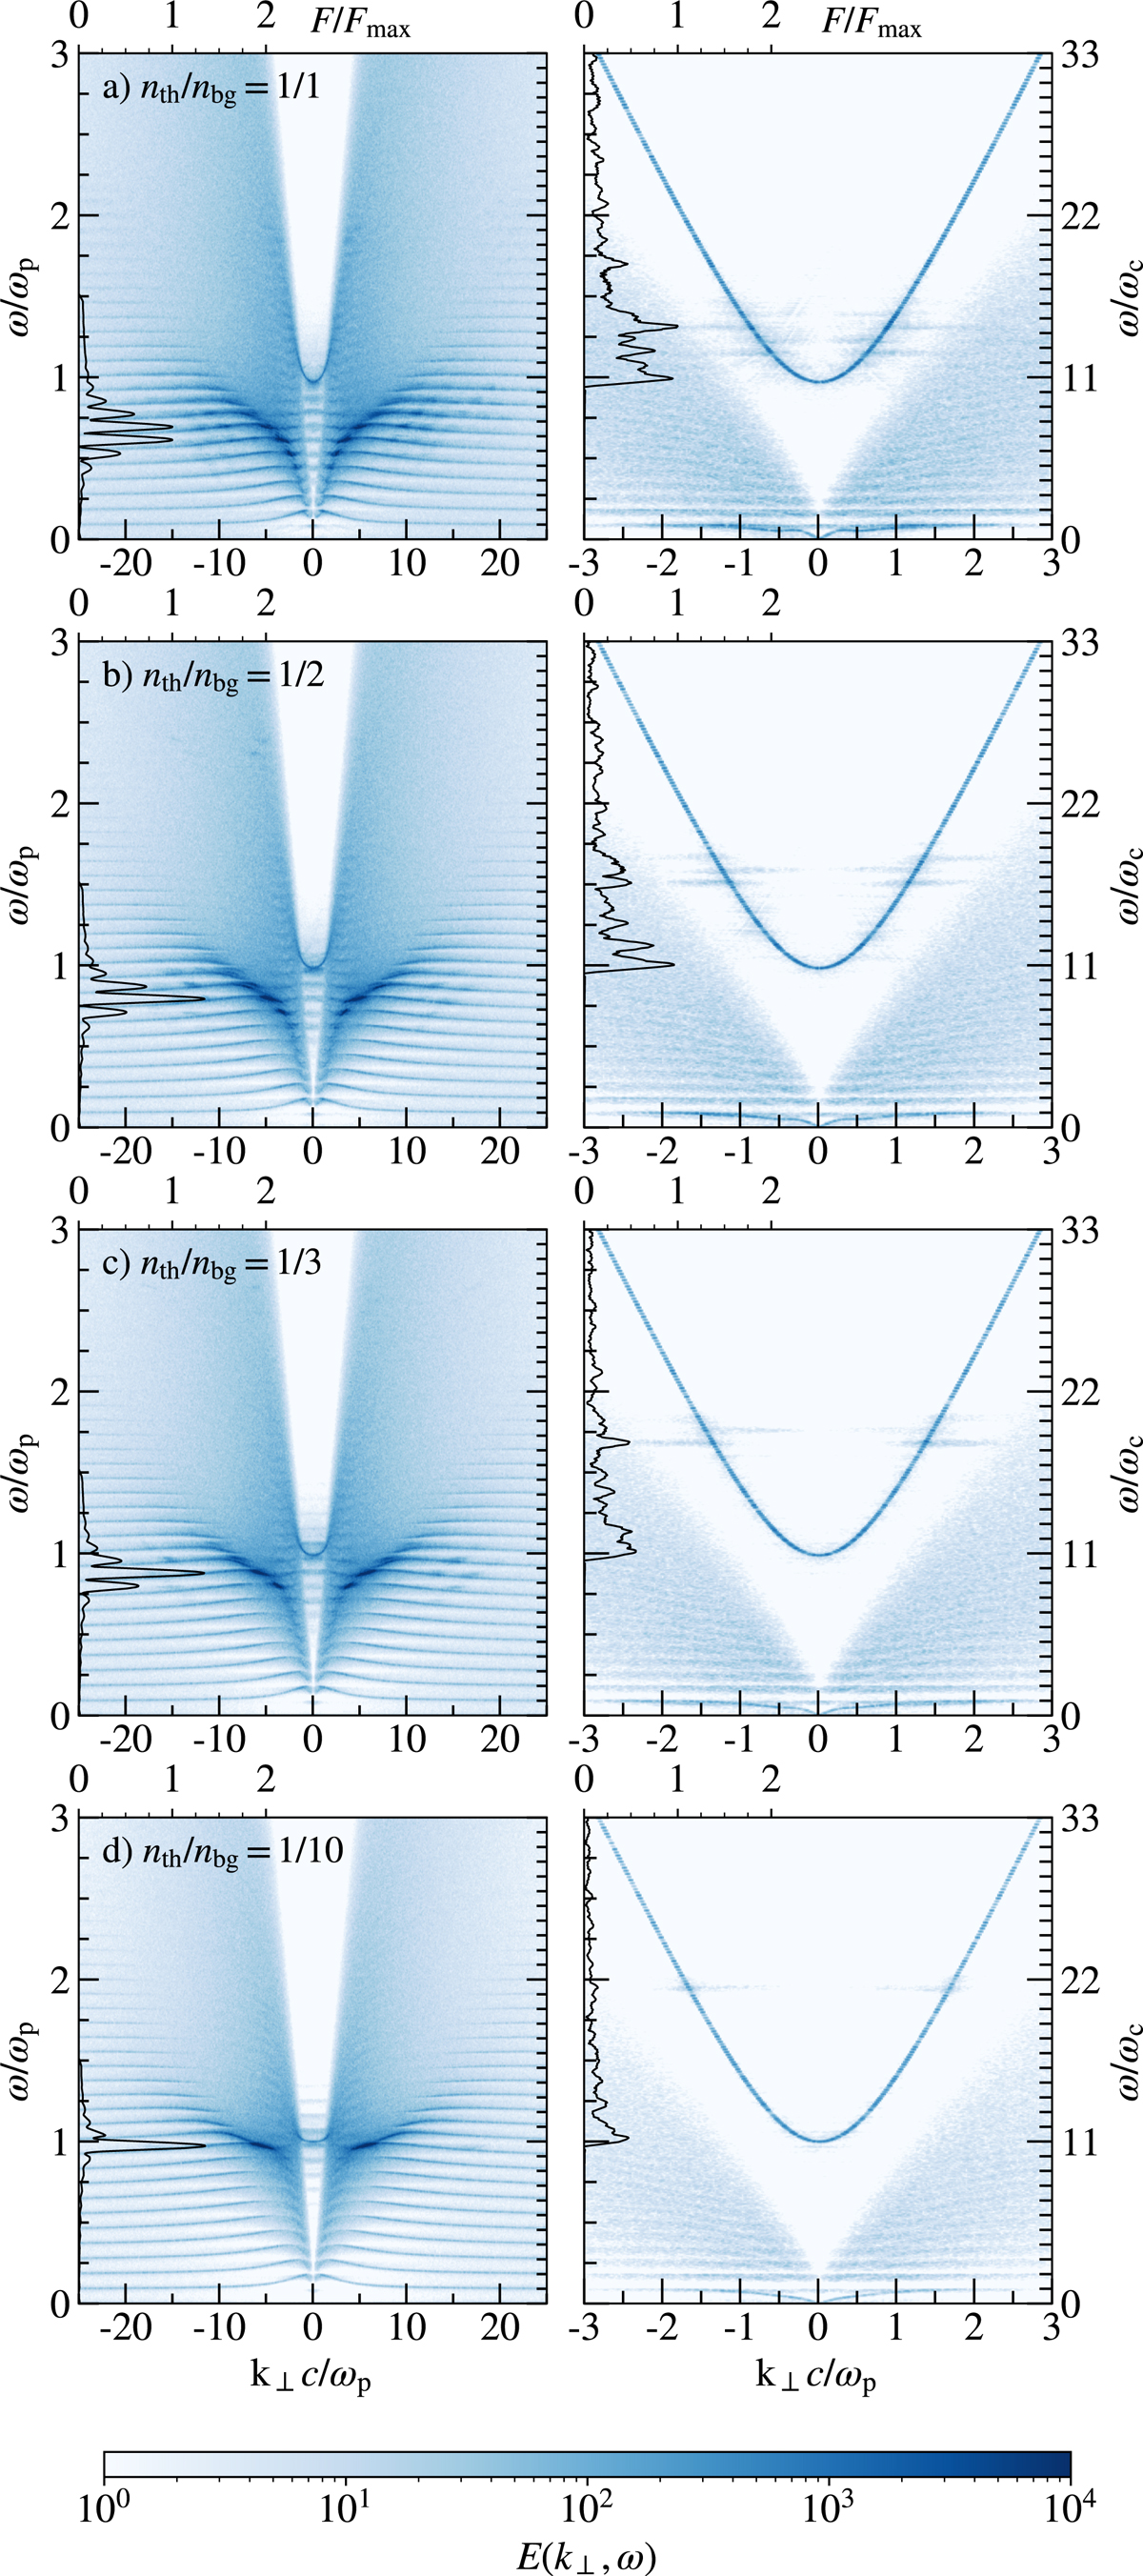
Download original image
Dispersion diagrams for various values of nth/ntb (rows) with frequency ratio ωp/ωc = 11 for the electron–positron plasma. Left column: Ex. Right column: Ey. Dispersion diagrams are overlaid with an integrated frequency profile scaled to the maximum of the top-most case (nth/ntb = 1).
Current usage metrics show cumulative count of Article Views (full-text article views including HTML views, PDF and ePub downloads, according to the available data) and Abstracts Views on Vision4Press platform.
Data correspond to usage on the plateform after 2015. The current usage metrics is available 48-96 hours after online publication and is updated daily on week days.
Initial download of the metrics may take a while.