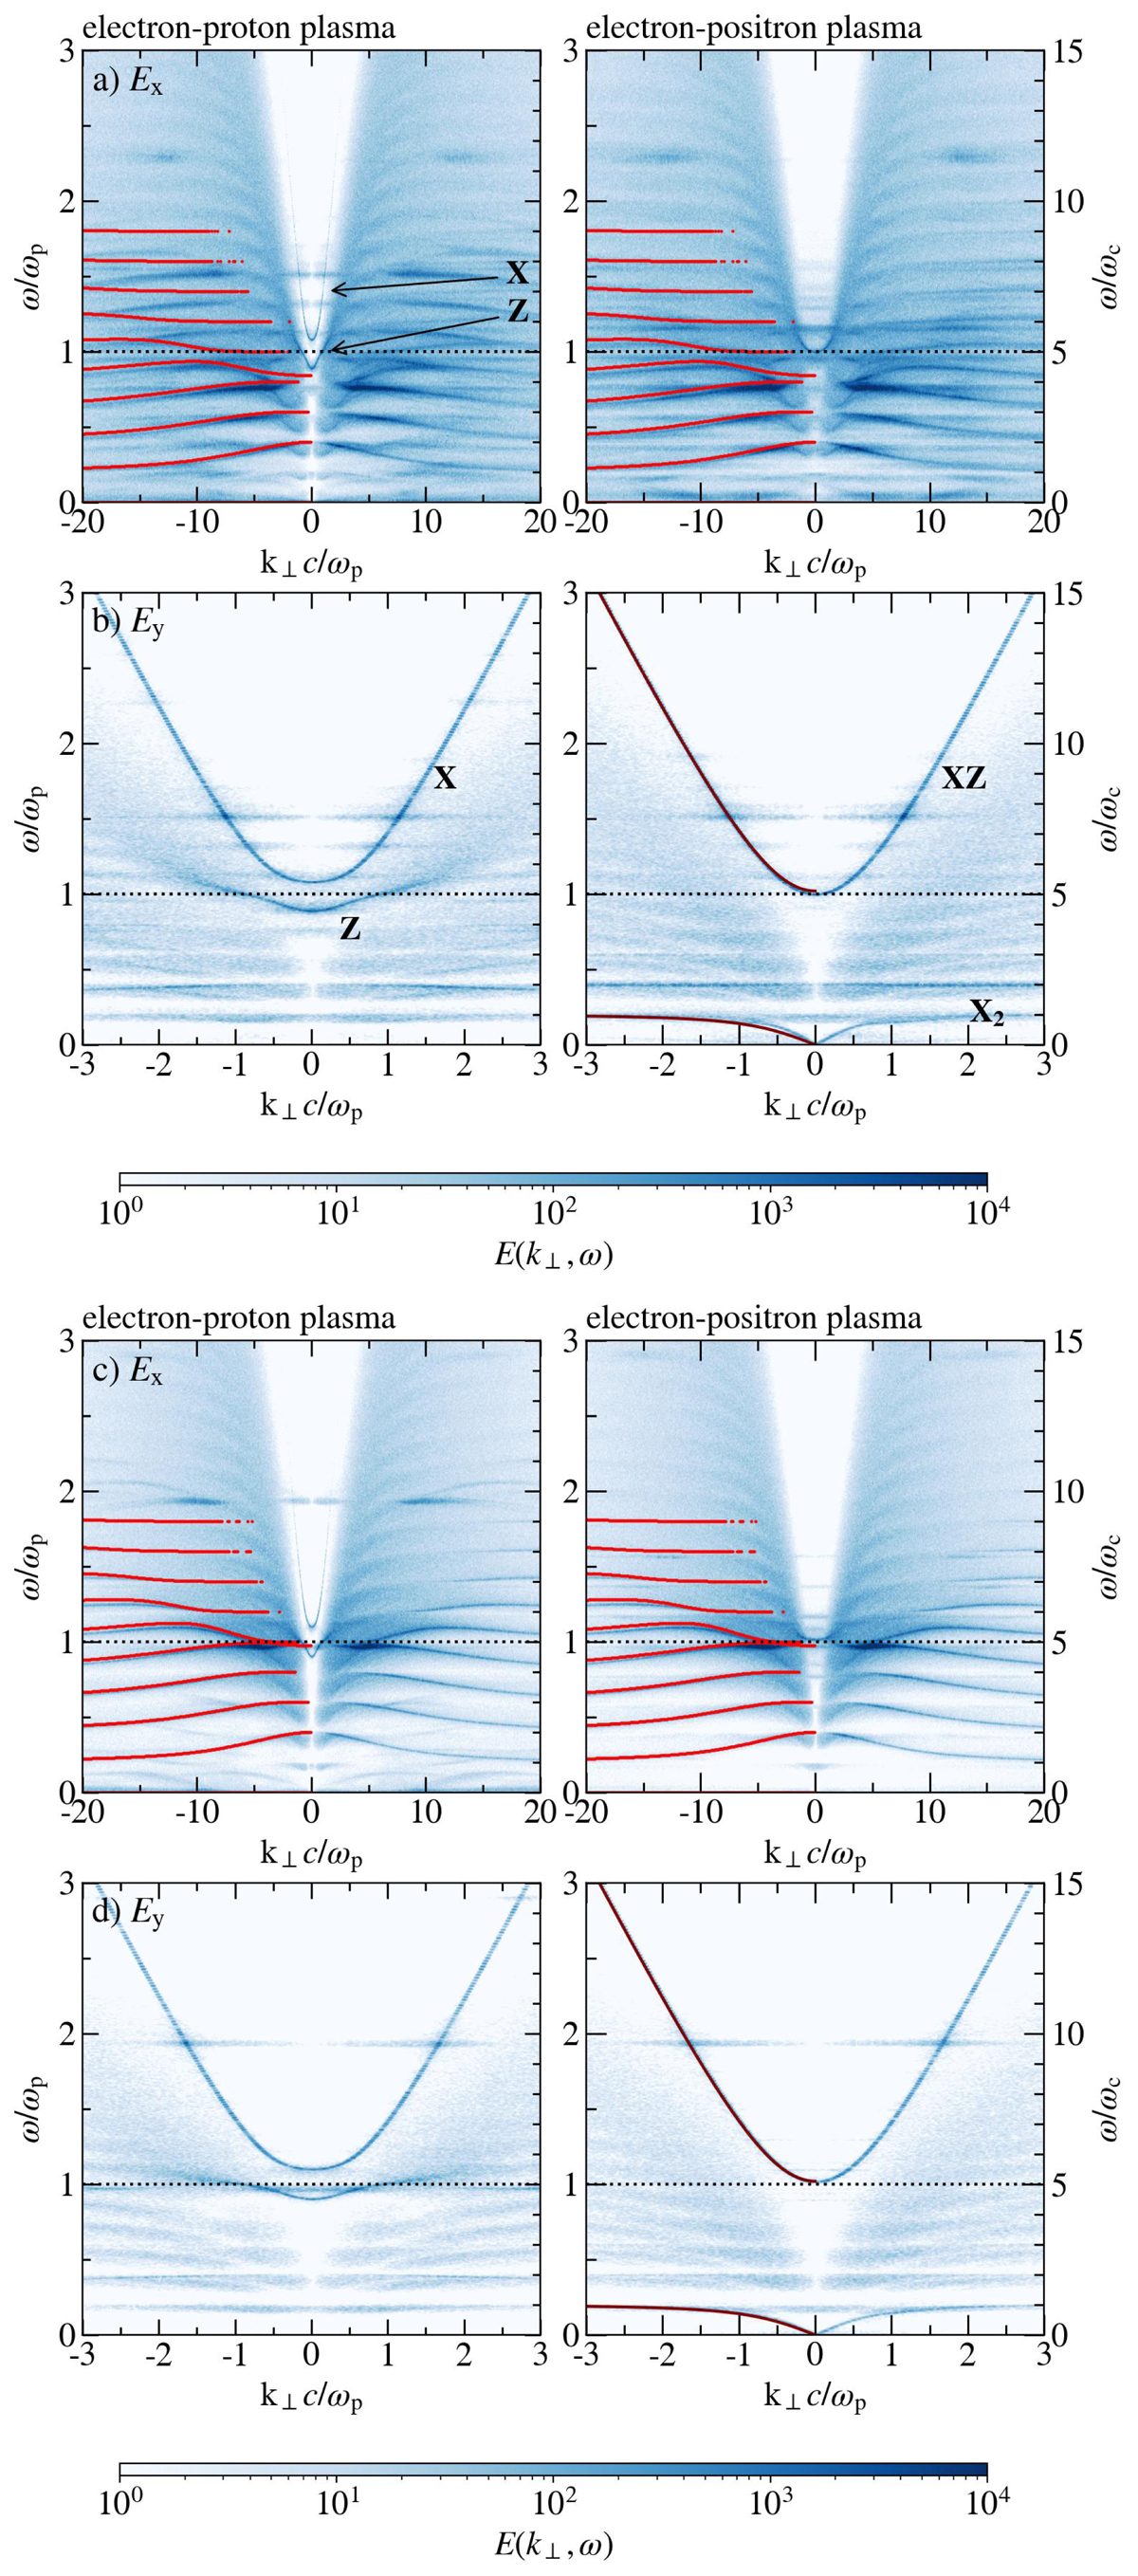
Fig. 3.
Download original image
Dispersion diagrams for electron–proton plasma (left column) and electron–positron plasma (right column) for frequency ratio ωp/ωc = 5 and density ratio between the hot and background plasma nth/ntb = 1/2 (a–b), 1/10 (c–d). The rows show the dispersion in the Ex (longitudinal waves) and Ey (transverse waves). The Bernstein (overlaid red curves), X, Z, X2, and XZ modes are denoted together with plasma frequency ωp (black dotted line). Analytical curves of X2 and XZ modes are overlaid in maroon for electron–positron plasma.
Current usage metrics show cumulative count of Article Views (full-text article views including HTML views, PDF and ePub downloads, according to the available data) and Abstracts Views on Vision4Press platform.
Data correspond to usage on the plateform after 2015. The current usage metrics is available 48-96 hours after online publication and is updated daily on week days.
Initial download of the metrics may take a while.