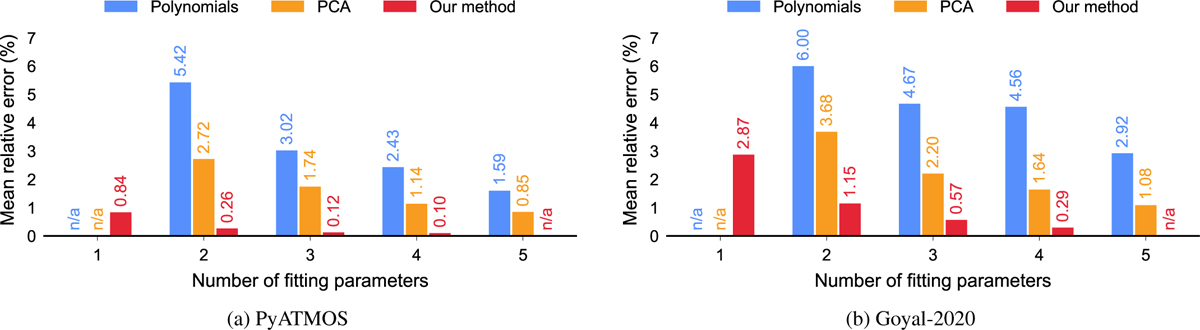
Fig. 6
Download original image
Comparison of the median test set MRE for the different methods and datasets (lower is better). Reminder: For each profile, we compute the mean relative error (over all atmospheric layers), and then aggregate by computing the median over all profiles. Finally, for the PCA baseline as well as our method, the results are also mean-averaged over different random seeds (https://github.com/timothygebhard/ml4ptp/blob/main/scripts/plotting/fig-6-mre-comparison/plot-mre-comparison.py).
Current usage metrics show cumulative count of Article Views (full-text article views including HTML views, PDF and ePub downloads, according to the available data) and Abstracts Views on Vision4Press platform.
Data correspond to usage on the plateform after 2015. The current usage metrics is available 48-96 hours after online publication and is updated daily on week days.
Initial download of the metrics may take a while.